Open Access
Fig. 2.
Download original image
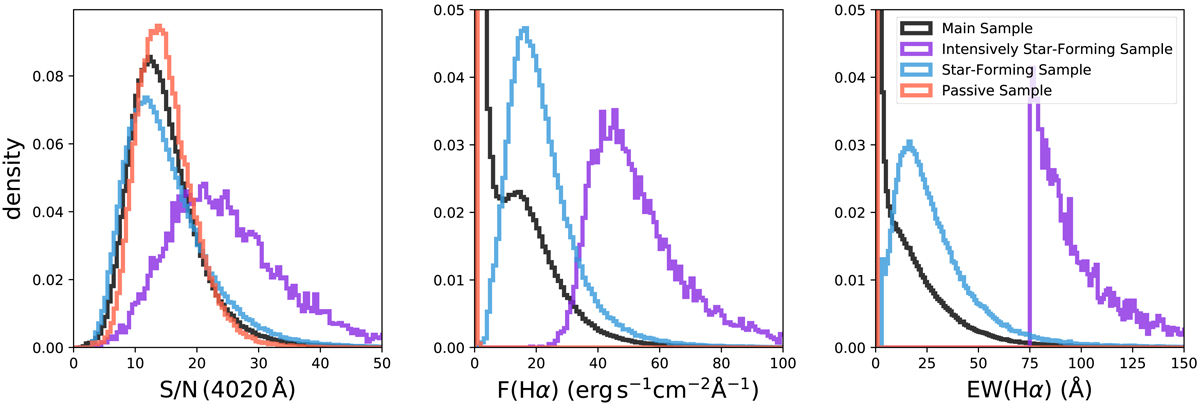
Density distributions of the signal-to-noise at the normalisation wavelength S/N(4020 Å), flux of the Hα emission line F(Hα) and Hα equivalent width EW(Hα) of the main, intensively star-forming, star-forming and passive samples represented by the black, violet, blue and red lines, respectively.
Current usage metrics show cumulative count of Article Views (full-text article views including HTML views, PDF and ePub downloads, according to the available data) and Abstracts Views on Vision4Press platform.
Data correspond to usage on the plateform after 2015. The current usage metrics is available 48-96 hours after online publication and is updated daily on week days.
Initial download of the metrics may take a while.