Fig. A.1
Download original image
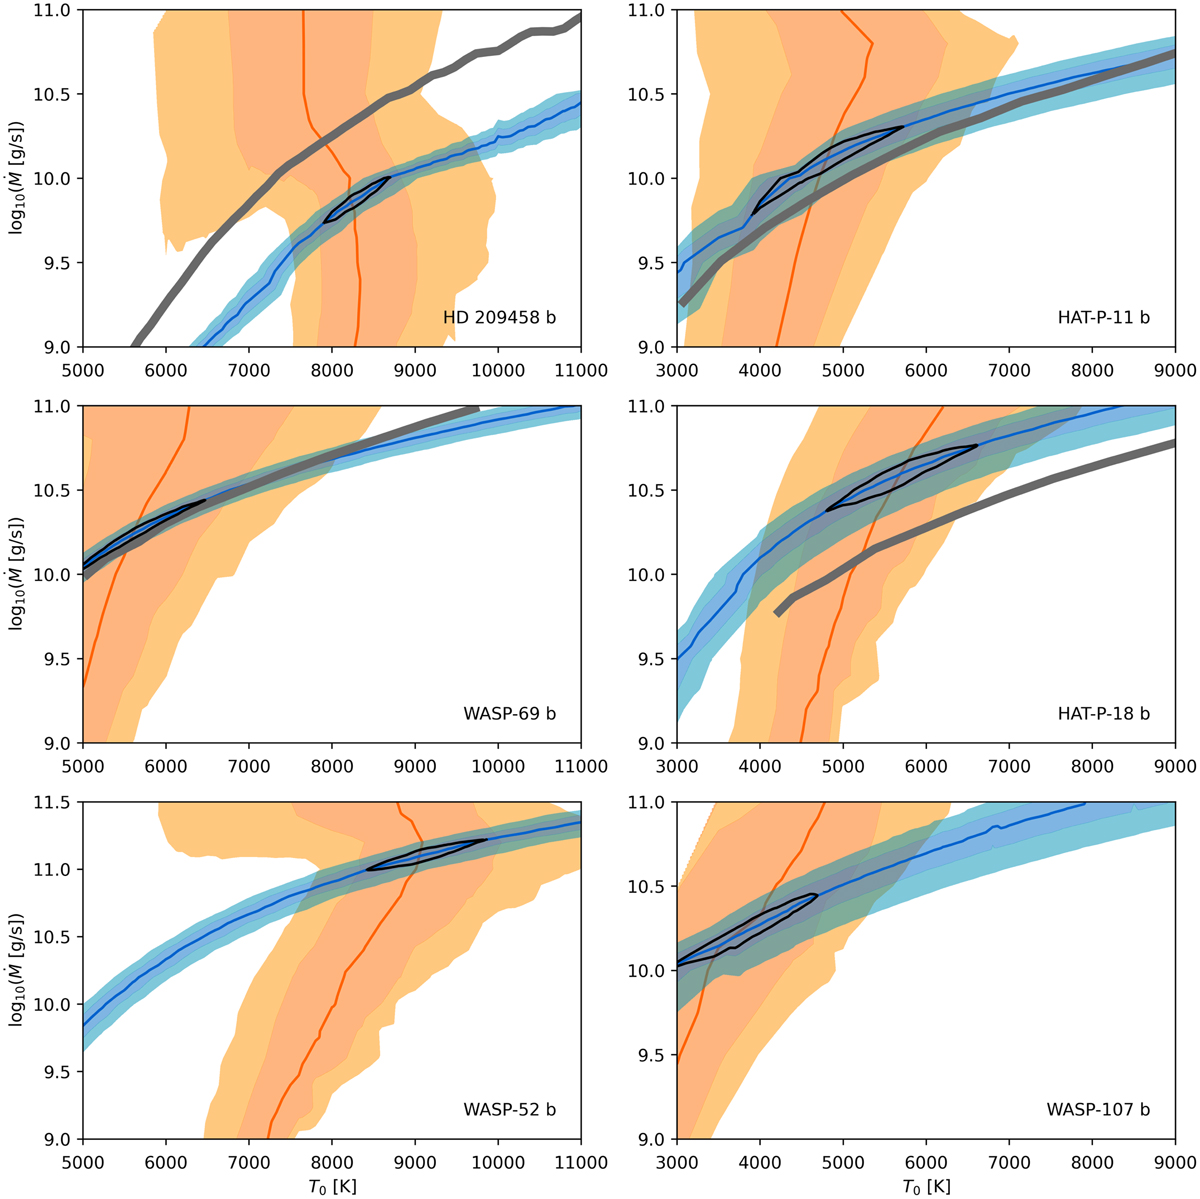
Similar to Fig. 5, but using the assumed fixed temperature T0 instead of Cloudy’s temperature T(r) to calculate the synthetic spectral lines. As a consequence, the observational fits shown in blue are different. The thick gray lines indicate the best-fit Parker wind models from similar analyses in the literature: Lampón et al. 2020 for HD 209458 b, Vissapragada et al. 2020 for WASP-69 b, Mansfield et al. 2018 for HAT-P-11 b and Paragas et al. 2021 for HAT-P-18 b (who used a transit depth of 0.46 ± 0.12% that is lower than our used value of 0.70 ± 0.16%). The thickness of the gray lines is arbitrary and does not represent the confidence intervals of those studies.
Current usage metrics show cumulative count of Article Views (full-text article views including HTML views, PDF and ePub downloads, according to the available data) and Abstracts Views on Vision4Press platform.
Data correspond to usage on the plateform after 2015. The current usage metrics is available 48-96 hours after online publication and is updated daily on week days.
Initial download of the metrics may take a while.