Fig. 6
Download original image
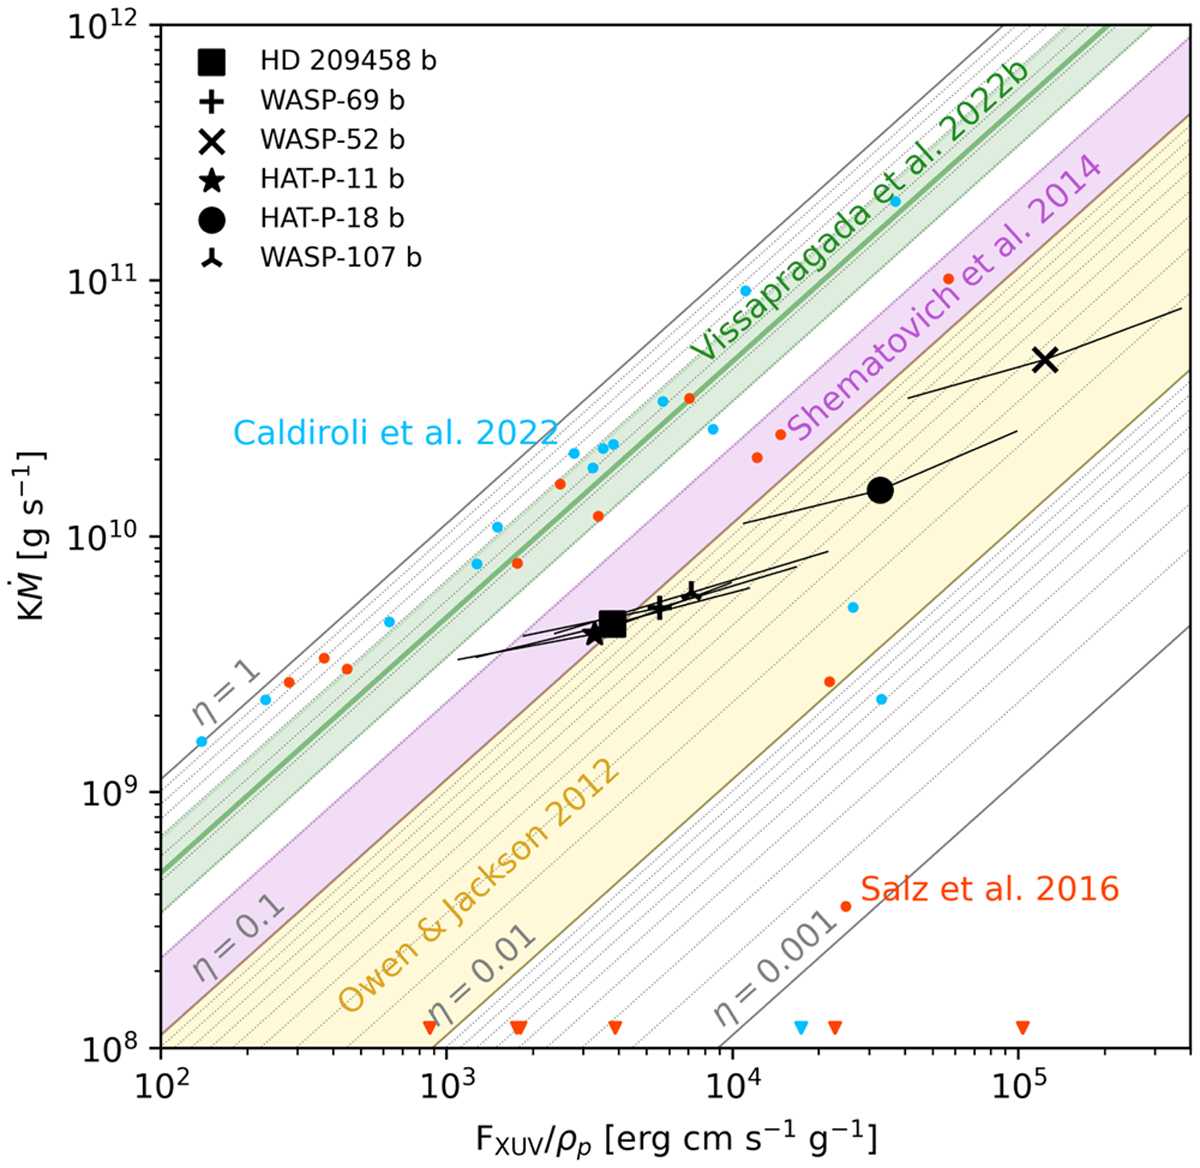
Mass-loss rate corrected by K as a function of the ratio of high-energy irradiation to bulk density. Our constraints are indicated by black scatter points, where the error bars indicate the results for the simulations at 1/3× and 3× EUV flux. The orange and blue scatter points show the results for the hydrodynamic simulations of Salz et al. (2016) and Caldiroli et al. (2022), respectively. The yellow and purple shaded regions indicate the constraints on the efficiency parameter of Owen & Jackson (2012) and Shematovich et al. (2014), respectively. The green line and shaded region mark the best-fit and 1σ contour of the efficiency constraint from Vissapragada et al. (2022b).
Current usage metrics show cumulative count of Article Views (full-text article views including HTML views, PDF and ePub downloads, according to the available data) and Abstracts Views on Vision4Press platform.
Data correspond to usage on the plateform after 2015. The current usage metrics is available 48-96 hours after online publication and is updated daily on week days.
Initial download of the metrics may take a while.