Fig. 4
Download original image
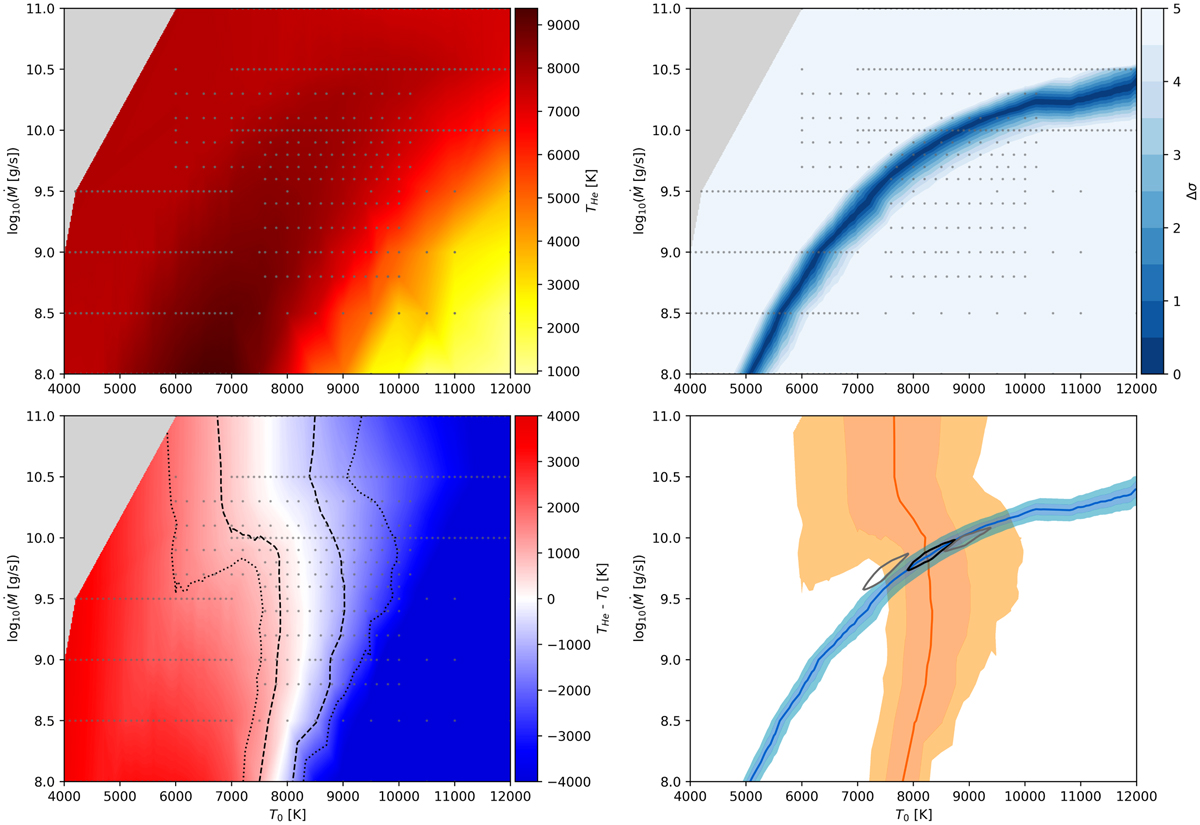
Top left: helium line-forming temperatures THe (Eq. (4)) for simulated temperature structures of HD 209458 b Parker wind models. The colormap linearly interpolates on the values of the models that were run (indicated by gray dots). The gray region in the upper left corner could not be simulated as Cloudy could not handle the high density of these models well. Bottom left: difference between THe (top left panel) and the assumed isothermal value T0. The dashed and dotted lines indicate the 1σ and 2σ standard deviations of the self-consistent region based on Eq. (5), respectively. Top right: compatibility between the He 10 830 Å EWs of the Parker wind models and the observed value from Alonso-Floriano et al. (2019). The dark blue region indicates good agreement. Bottom right: joint constraint on the mass-loss rate and temperature. The orange line and dark and light areas are the self-consistent models, 1σ and 2σ contours from the bottom left panel, respectively, which we use as our prior. The blue line and dark and light areas are the best-fit models, 1σ and 2σ contours from the top right panel, respectively, which are our likelihood values. The 1σ contour of the posterior is shown in black. The 1σ posteriors of the 3× and 1/3× EUV flux simulations are shown in gray.
Current usage metrics show cumulative count of Article Views (full-text article views including HTML views, PDF and ePub downloads, according to the available data) and Abstracts Views on Vision4Press platform.
Data correspond to usage on the plateform after 2015. The current usage metrics is available 48-96 hours after online publication and is updated daily on week days.
Initial download of the metrics may take a while.