Fig. 2
Download original image
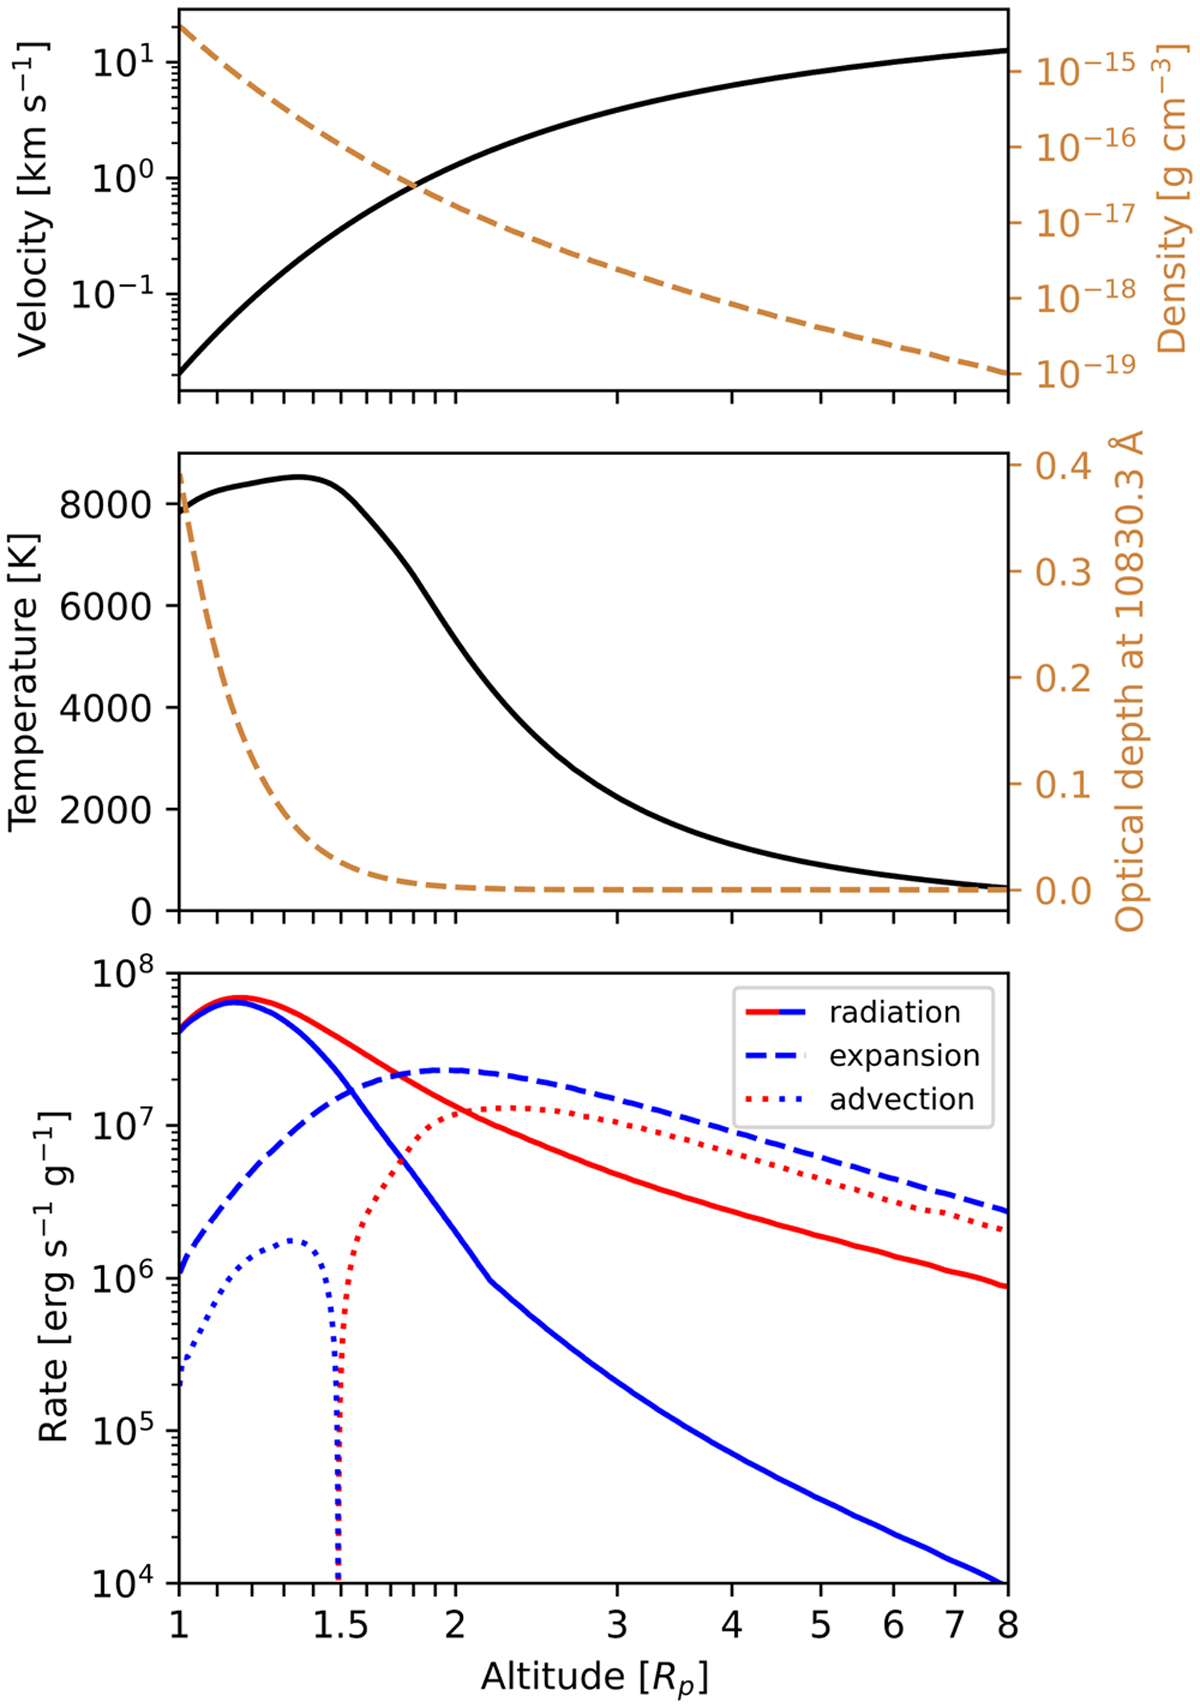
Top: velocity (black) and density (dashed orange, read from the right y-axis) structure for the Parker wind profile of HD 209458 b with T0 = 8000 K, ![]() g s−1. Middle: simulated temperature structure (black) and optical depth (dashed orange, read from the right y-axis) in the major component of the metastable helium line. Bottom: relevant heating and cooling rates shown in red and blue, respectively. We observe that at lower altitudes (≲2Rp), radiative heating and cooling dominate, while at higher altitudes (≳3Rp), advection heating and expansion cooling are the dominant thermal processes.
g s−1. Middle: simulated temperature structure (black) and optical depth (dashed orange, read from the right y-axis) in the major component of the metastable helium line. Bottom: relevant heating and cooling rates shown in red and blue, respectively. We observe that at lower altitudes (≲2Rp), radiative heating and cooling dominate, while at higher altitudes (≳3Rp), advection heating and expansion cooling are the dominant thermal processes.
Current usage metrics show cumulative count of Article Views (full-text article views including HTML views, PDF and ePub downloads, according to the available data) and Abstracts Views on Vision4Press platform.
Data correspond to usage on the plateform after 2015. The current usage metrics is available 48-96 hours after online publication and is updated daily on week days.
Initial download of the metrics may take a while.