Fig. 1
Download original image
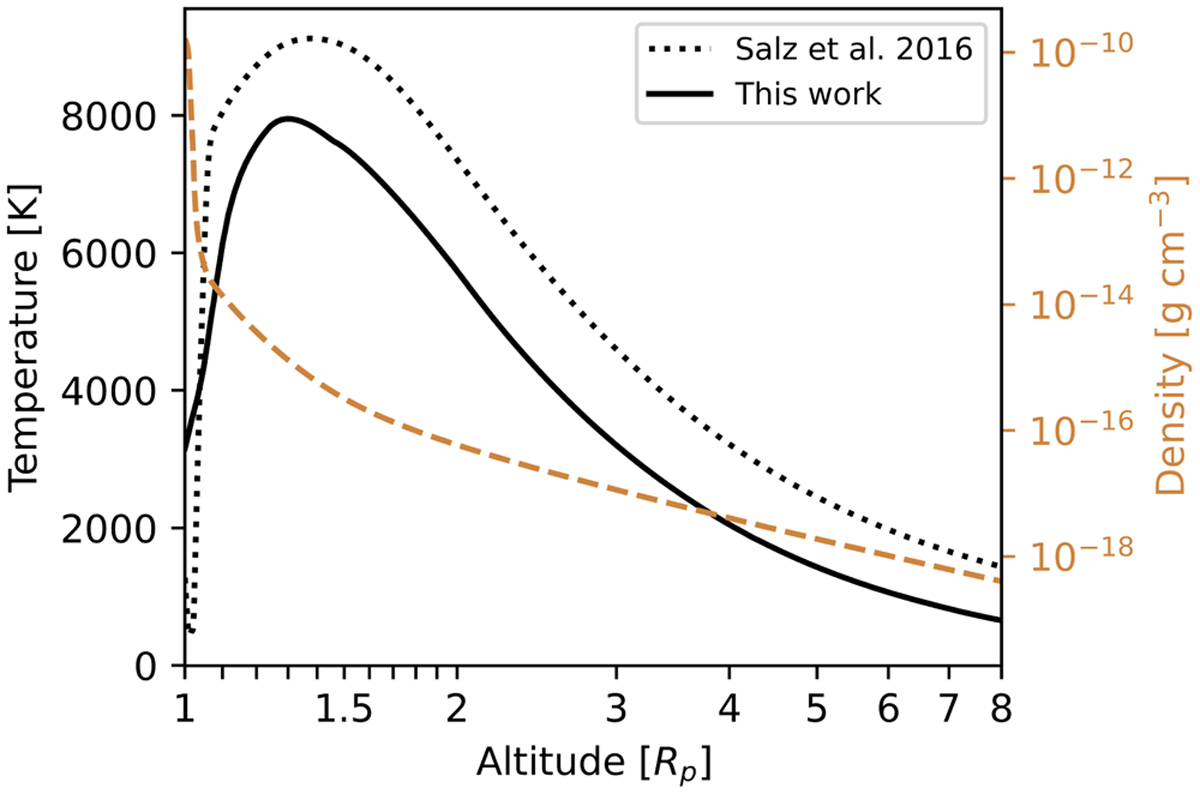
Comparison of simulated temperature structures for the density profile of HD 209458 b from Salz et al. (2016). The orange dashed line shows the density structure (read from the right y-axis). Although not shown here, the qualitative behavior of the different heating and cooling rates as a function of altitude (such as shown for a different model in the bottom panel of Fig. 2) is similar to the results of Salz et al. (2016), shown in their Fig. 5.
Current usage metrics show cumulative count of Article Views (full-text article views including HTML views, PDF and ePub downloads, according to the available data) and Abstracts Views on Vision4Press platform.
Data correspond to usage on the plateform after 2015. The current usage metrics is available 48-96 hours after online publication and is updated daily on week days.
Initial download of the metrics may take a while.