Open Access
Fig. 8
Download original image
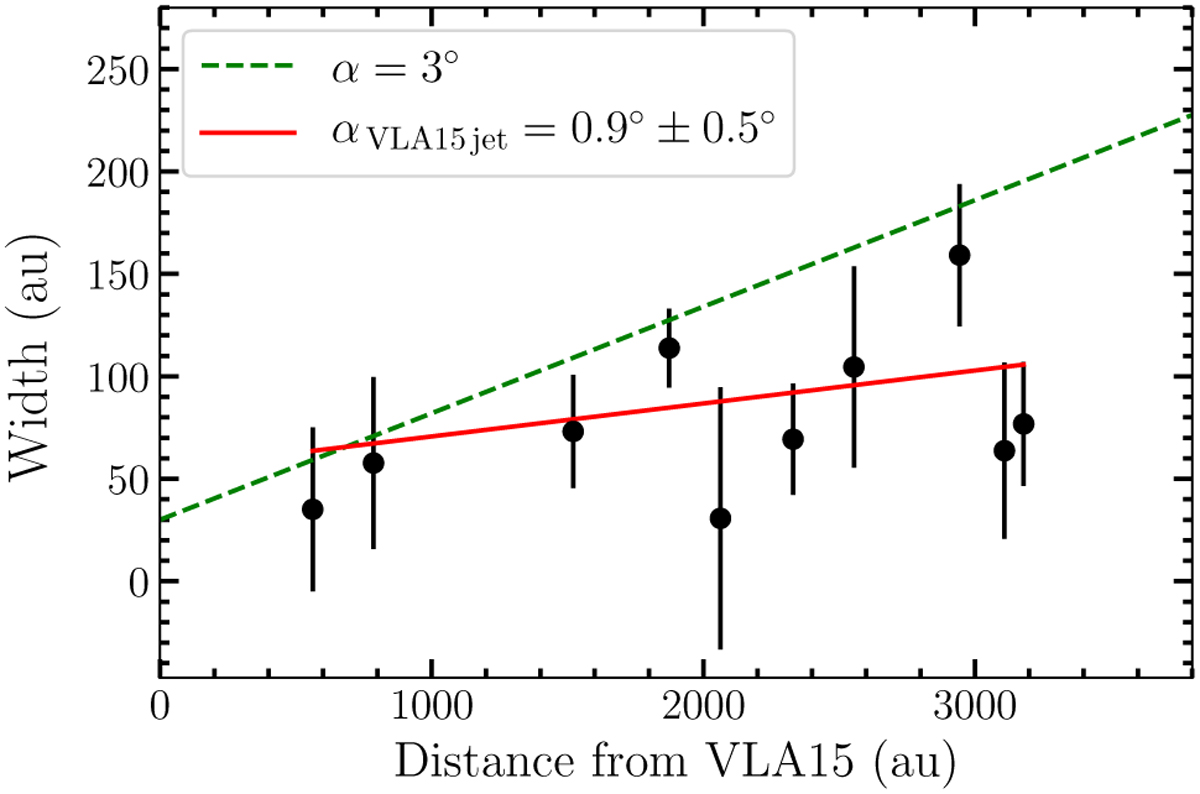
Deconvolved widths (2Rjet) of the SiO(6–5) emission along the jet axis as a function of the distance from VLA15. The solid red line corresponds to the best fit of the data points. The dashed green line corresponds to an opening angle of α = 3° and an initial width of 30 au.
Current usage metrics show cumulative count of Article Views (full-text article views including HTML views, PDF and ePub downloads, according to the available data) and Abstracts Views on Vision4Press platform.
Data correspond to usage on the plateform after 2015. The current usage metrics is available 48-96 hours after online publication and is updated daily on week days.
Initial download of the metrics may take a while.