Fig. 7
Download original image
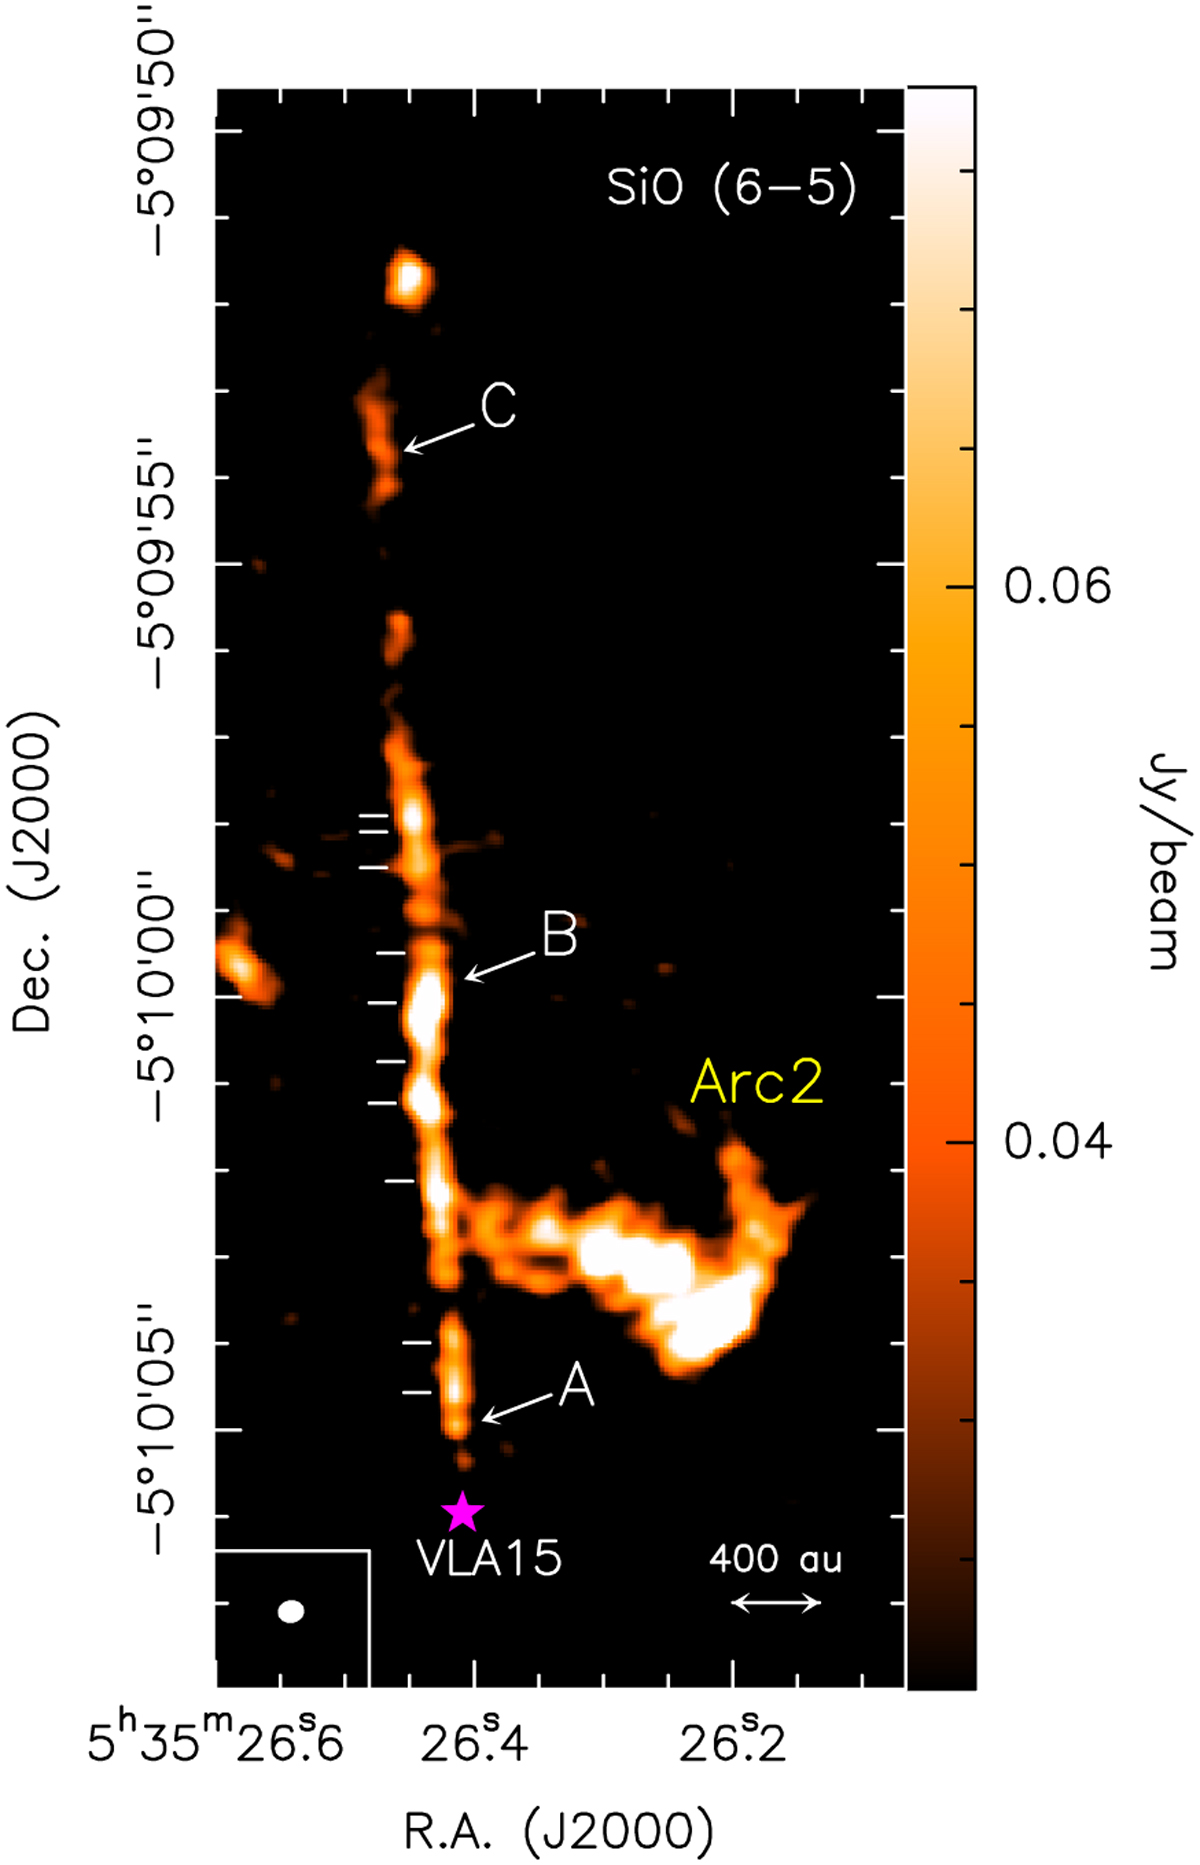
Velocity-integrated emission of the SiO jet driven by VLA15. The colour images are for intensities higher than 3σ with σ = 4.8 mJy beam−1 km s−1. The cut positions at which the widths were measured are shown with white horizontal lines. The knot positions at which the dynamical ages are estimated are shown with arrows and are labelled in white. VLA15 is depicted with a magenta star and labelled in white. The synthesised beam is depicted in the lower left corner.
Current usage metrics show cumulative count of Article Views (full-text article views including HTML views, PDF and ePub downloads, according to the available data) and Abstracts Views on Vision4Press platform.
Data correspond to usage on the plateform after 2015. The current usage metrics is available 48-96 hours after online publication and is updated daily on week days.
Initial download of the metrics may take a while.