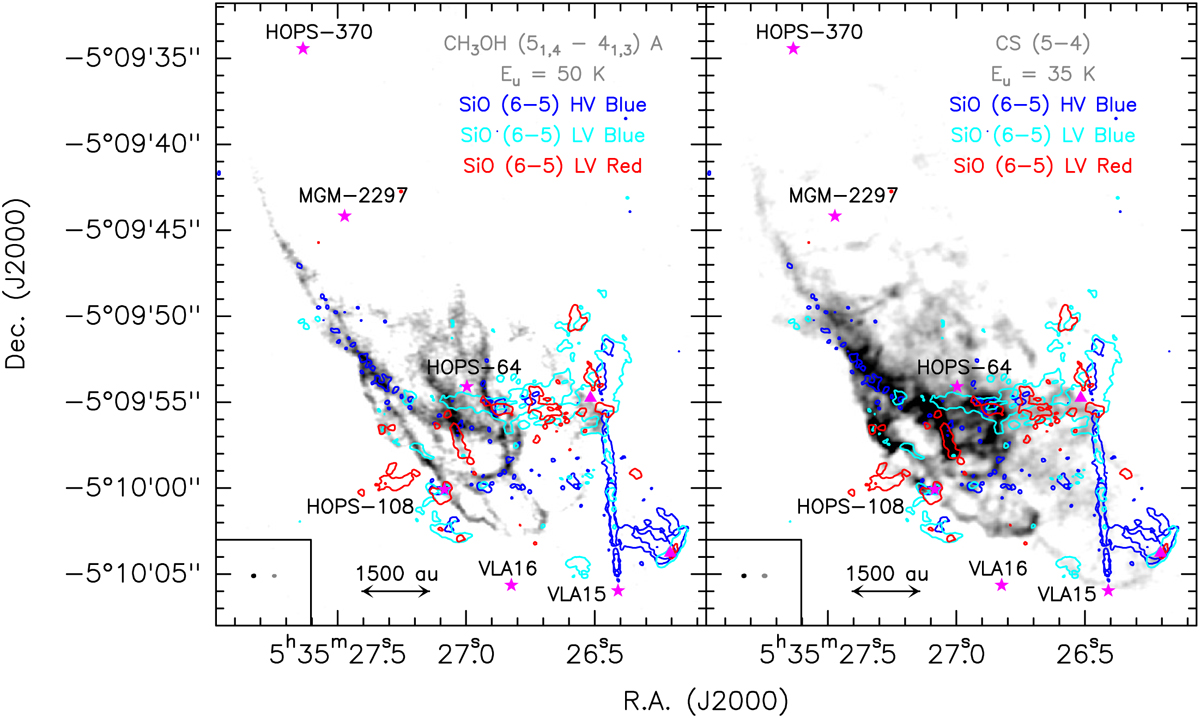
Fig. 5
Download original image
Velocity-integrated maps of CH3OH and CS reported in Fig. 1 with superimposed contours of the velocity-integrated emission of SiO at different velocity regimes. The colour images are as in Fig. 1. The SiO contours are at 5σ with σ = 5.8 mJy beam−1 km s−1. They correspond to the blueshifted high-velocity regime (blue), the blueshifted low-velocity regime (white), and the redshifted low-velocity regime (red) (see Sect. 3.2). The different cores are depicted with magenta stars and are labelled in black. The positions of the SiO peaks from this study are depicted with filled magenta triangles.
Current usage metrics show cumulative count of Article Views (full-text article views including HTML views, PDF and ePub downloads, according to the available data) and Abstracts Views on Vision4Press platform.
Data correspond to usage on the plateform after 2015. The current usage metrics is available 48-96 hours after online publication and is updated daily on week days.
Initial download of the metrics may take a while.