Fig. 3
Download original image
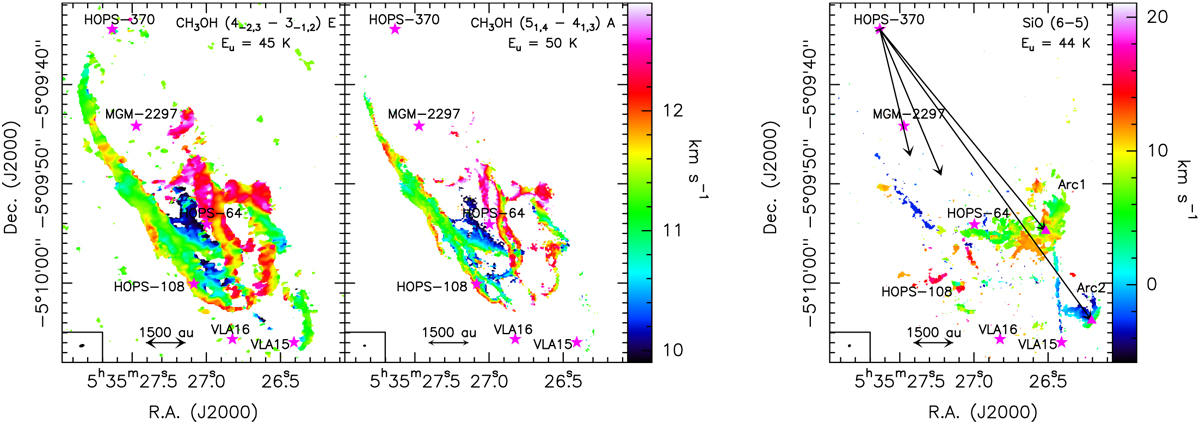
Velocity maps of CH3OH and SiO towards OMC-2 FIR 4. Left panel: velocity maps (integrated between 9.9 and 12.9 km s−1; colour scale in km s−1) of CH3OH (4−2,3 − 3−1,2 E) (left) and CH3OH (51,4 − 41,3 A) (right). Right panel: velocity map (integrated between ~6.2 and 24.4 km s−1; colour scale in km s−1) of SiO(6−5). The different cores are depicted with magenta stars and are labelled in black. The positions of the SiO peaks from this study are depicted with filled magenta triangles. We draw four arrows from HOPS-370, one perpendicular to the disk, two towards the SiO peaks, and one similar to the direction of the jet in [OI] by González-García et al. (2016).
Current usage metrics show cumulative count of Article Views (full-text article views including HTML views, PDF and ePub downloads, according to the available data) and Abstracts Views on Vision4Press platform.
Data correspond to usage on the plateform after 2015. The current usage metrics is available 48-96 hours after online publication and is updated daily on week days.
Initial download of the metrics may take a while.