Fig. C.4
Download original image
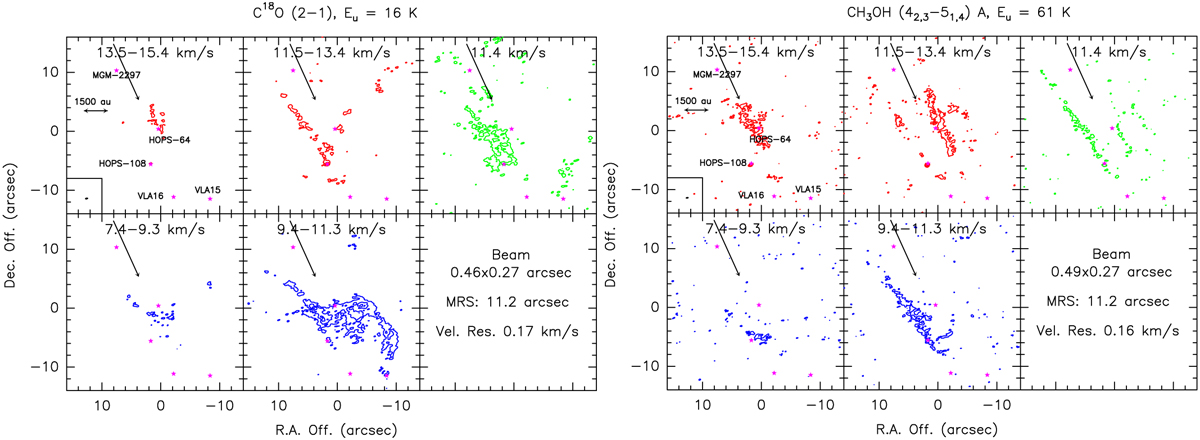
Channel maps of C18O (left) and CH3OH at 61 K (right). Contours start at 5σ for C18O, and 3σ for CH3OH and increase by 5σ with σ= (4 mJy beam−1 km s−1 left, and 6 mJy beam−1 km s−1 right). The cores are depicted with magenta stars and are labelled in black. The synthesised beam is depicted in the lower left corner. We draw one arrow from HOPS-370 perpendicular to its disk. The beam, MRS, and velocity resolution values are reported in the bottom right panel.
Current usage metrics show cumulative count of Article Views (full-text article views including HTML views, PDF and ePub downloads, according to the available data) and Abstracts Views on Vision4Press platform.
Data correspond to usage on the plateform after 2015. The current usage metrics is available 48-96 hours after online publication and is updated daily on week days.
Initial download of the metrics may take a while.