Fig. A.2
Download original image
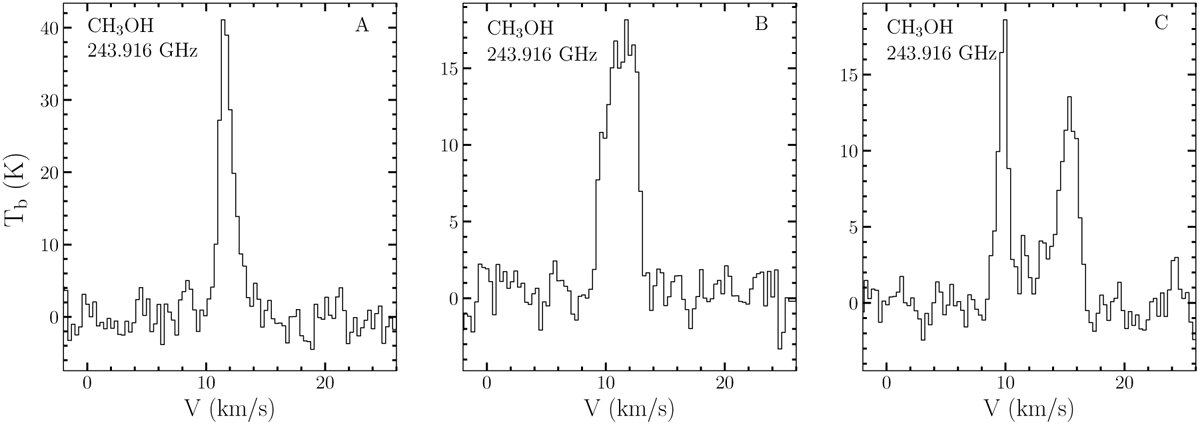
CH3OH (51.4 − 41,3 A) spectra extracted from three different positions (A, B, and C) shown in the moment-2 map (See Fig. 4). The first shows a region with low-velocity dispersion, the second shows a region with intermediate-velocity dispersion, and the third shows the central region with several components along the line of sight.
Current usage metrics show cumulative count of Article Views (full-text article views including HTML views, PDF and ePub downloads, according to the available data) and Abstracts Views on Vision4Press platform.
Data correspond to usage on the plateform after 2015. The current usage metrics is available 48-96 hours after online publication and is updated daily on week days.
Initial download of the metrics may take a while.