Fig. 1
Download original image
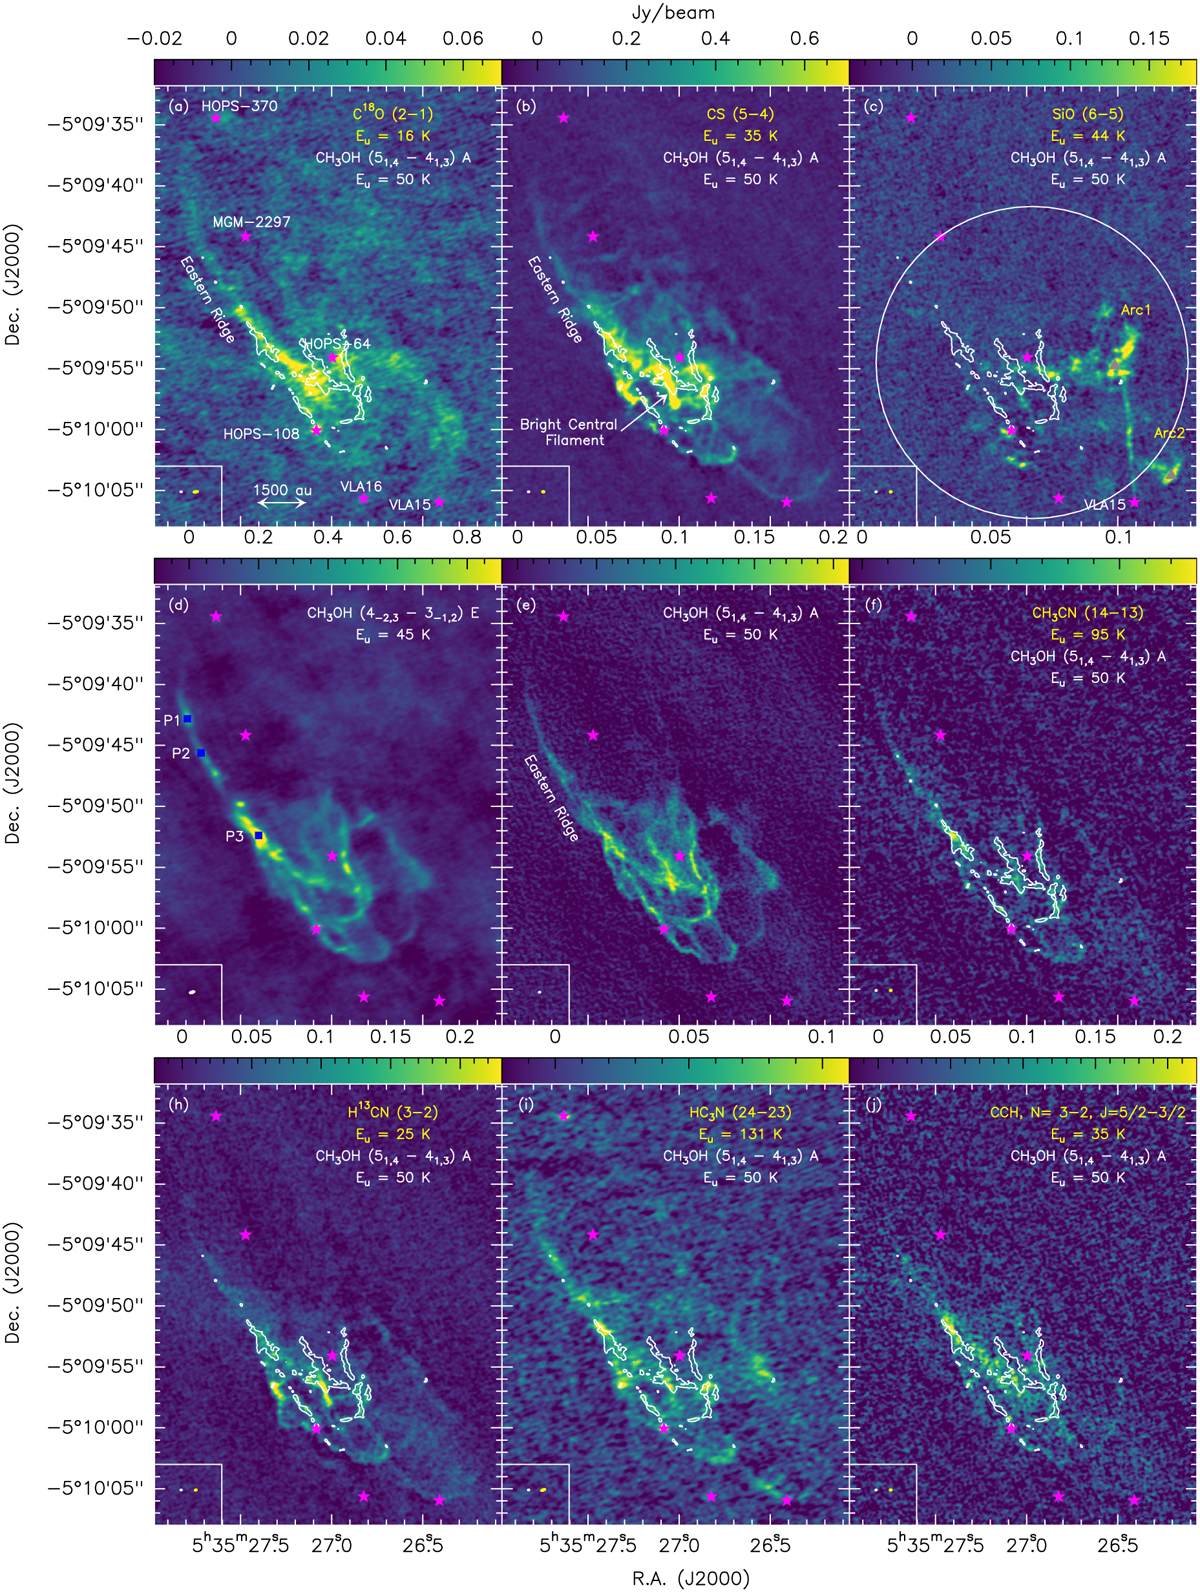
Velocity-integrated maps of the different tracers used to probe the emission towards OMC-2 FIR 4. Upper panels: velocity-integrated maps of C18O, CS and SiO in colours, with superimposed contours of the velocity-integrated emission of CH3OH (51,4 − 41,3 A) line (white). The colour scale wedges are shown at the top of each panel. The different cores are depicted with magenta stars and are labelled in white. The synthesised beam of CH3OH and the other molecules are depicted in the lower left corner in white and yellow, respectively. In the SiO panel, the positions of the SiO peaks from this study are depicted with filled grey triangles. The primary beam at the full width at half maximum is depicted in white. Middle panels: velocity-integrated maps of CH3OH lines at Eu = 45 K and Eu = 50 K and of CH3CN. On the latter, we superimposed the contours of the velocity-integrated emission of CH3OH (51,4 − 41,3 A) line (white). The colour scale wedges are shown at the top of each panel. The positions of the three masers detected in CH3OH (4−2,3 − 3−1,2 E) are depicted with filled blue squares. Lower panels: velocity-integrated maps of H13CN, HC3N and CCH in colours with superimposed contours of the velocity-integrated emission of CH3OH (51,4 − 41,3 A) line (white). The colour scale wedges are shown at the top of each panel. The methanol contours start at 10σ with σ = 12.3 mJy beam−1 km s−1.
Current usage metrics show cumulative count of Article Views (full-text article views including HTML views, PDF and ePub downloads, according to the available data) and Abstracts Views on Vision4Press platform.
Data correspond to usage on the plateform after 2015. The current usage metrics is available 48-96 hours after online publication and is updated daily on week days.
Initial download of the metrics may take a while.