Open Access
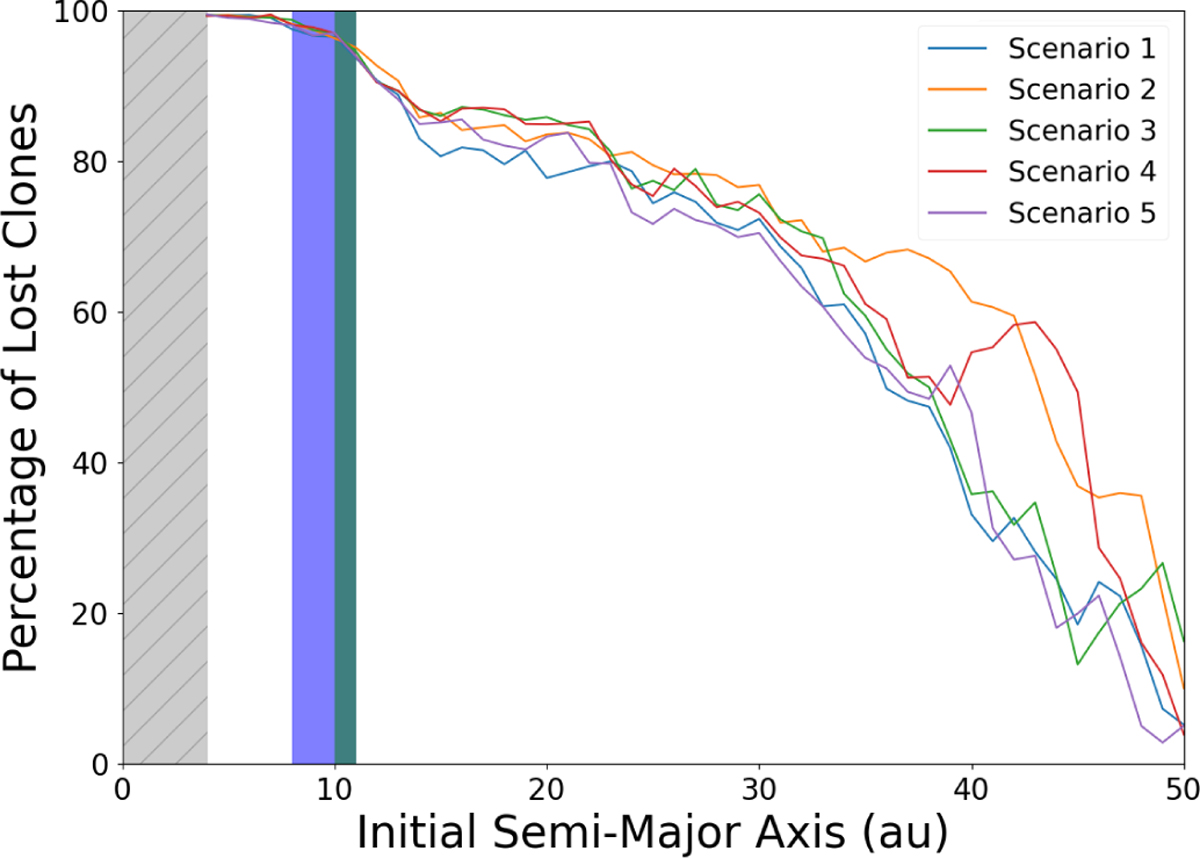
Fig. 3
Download original image
Percentage of clones lost per formation location for each of the five scenarios. The gray zone indicates the limitation of our simulation. The blue zone indicates the N2/CO enrichment zone as predicted by Mousis et al. (2021), while the overlaid green zone indicates the location of the ideal CO/H2O enrichment zone.
Current usage metrics show cumulative count of Article Views (full-text article views including HTML views, PDF and ePub downloads, according to the available data) and Abstracts Views on Vision4Press platform.
Data correspond to usage on the plateform after 2015. The current usage metrics is available 48-96 hours after online publication and is updated daily on week days.
Initial download of the metrics may take a while.