Fig. 4
Download original image
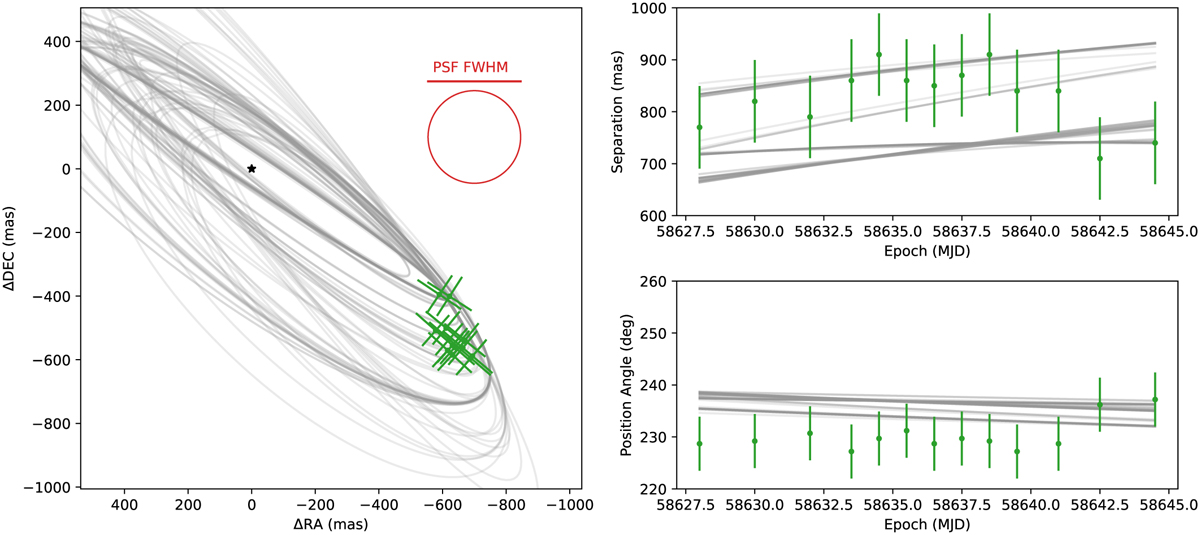
Plot at two dimensions of the orbits projected on the sky, shown on the left. The 84 best orbits found by K-Stacker are shown in grey. The green crosses show the astrometric positions with their error bar given by Wagner et al. (2021). The red circle shows the size of the FWHM-PSF used to integrate the flux in K-Stacker. Right: zoom at the positions found by K-Stacker and Wagner et al. (2021) in ID plots in separation and position angles.
Current usage metrics show cumulative count of Article Views (full-text article views including HTML views, PDF and ePub downloads, according to the available data) and Abstracts Views on Vision4Press platform.
Data correspond to usage on the plateform after 2015. The current usage metrics is available 48-96 hours after online publication and is updated daily on week days.
Initial download of the metrics may take a while.