Fig. 3
Download original image
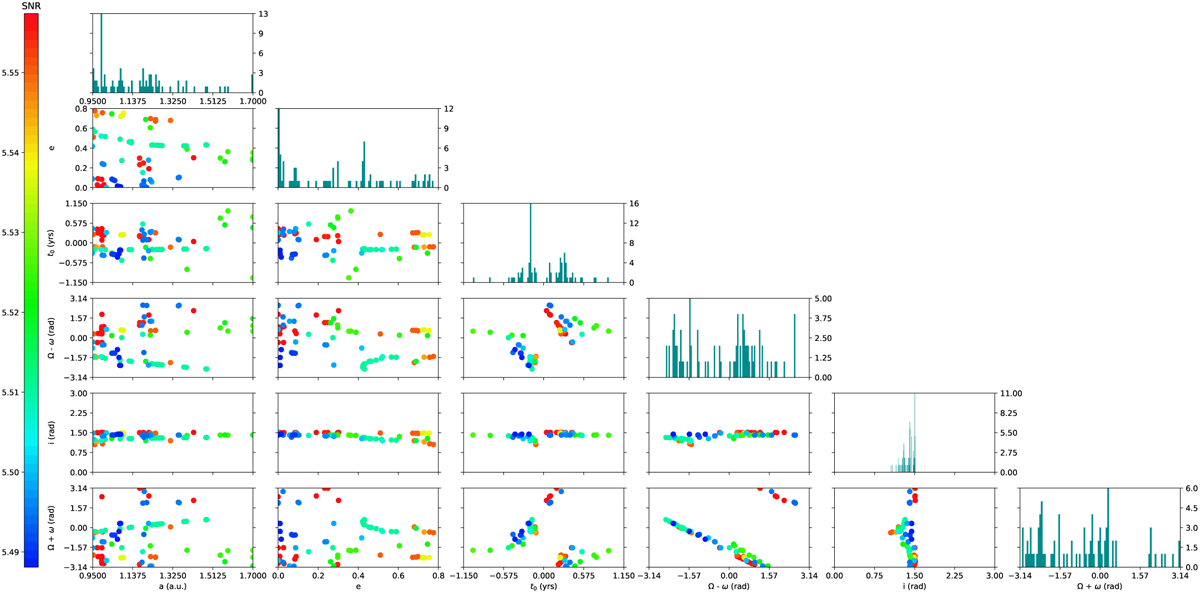
Corner plots of the orbital parameters found by K-Stacker for α CenA CI. At left and bottom: scale of the orbital parameters. Right: scale of the histograms. The 84 points showed in each 2D diagram corresponds to the 84 orbits with the highest (S/N)KS found by K-Stacker. The color of each point gives the K-Stacker signal to noise indicated at left. The origin of the t0 K-Stacker date is 2019 - 05 - 24.
Current usage metrics show cumulative count of Article Views (full-text article views including HTML views, PDF and ePub downloads, according to the available data) and Abstracts Views on Vision4Press platform.
Data correspond to usage on the plateform after 2015. The current usage metrics is available 48-96 hours after online publication and is updated daily on week days.
Initial download of the metrics may take a while.