Fig. A.1
Download original image
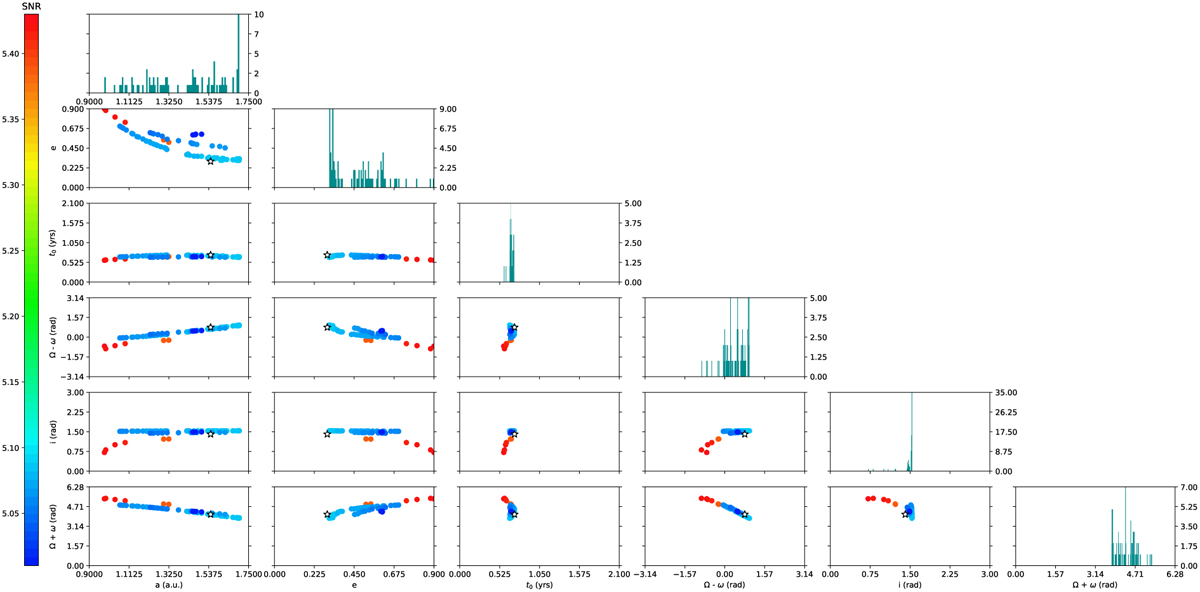
Corner plots of the orbital parameters found by K-Stacker in a hypothetical scenario in which the NEAR images span a total of 6 months (one observation every 11 days) and assuming that the planet is following an orbit given by a = 1.55 au, e = 0.3, t0 = 0.72 yr, Ω = 2.44 rad, i = 1.41 rad, and θ0 = 1.65 rad. The 84 points showed in each 2D diagram corresponds to the 84 orbits with the highest (S/N)KS found by K-Stacker. The color of each point gives the K-Stacker S/N values indicated at left. The star symbol shows the position of the injected planet in the corner plots.
Current usage metrics show cumulative count of Article Views (full-text article views including HTML views, PDF and ePub downloads, according to the available data) and Abstracts Views on Vision4Press platform.
Data correspond to usage on the plateform after 2015. The current usage metrics is available 48-96 hours after online publication and is updated daily on week days.
Initial download of the metrics may take a while.