Fig. 8.
Download original image
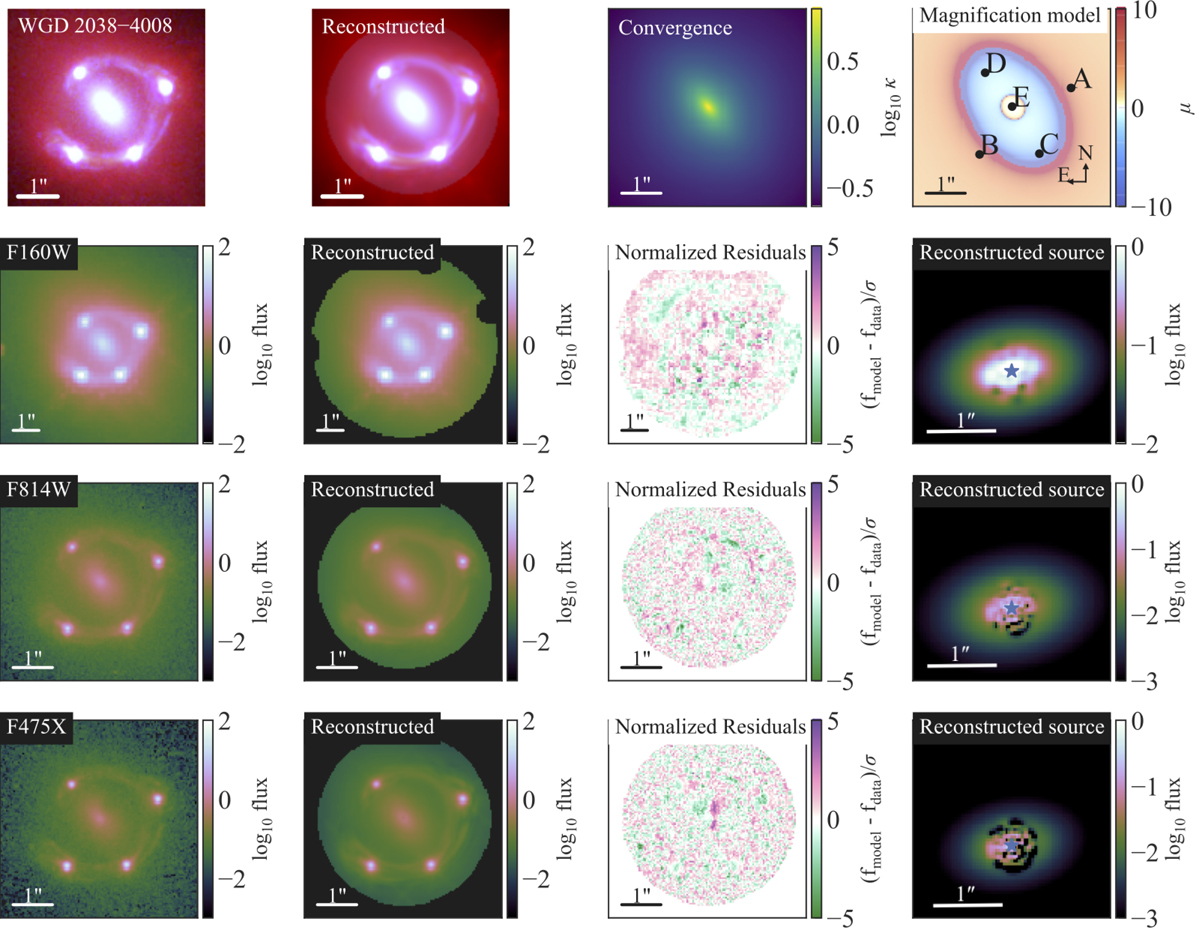
Most likely LENSTRONOMY lens model and reconstructed image of WGD 2038−4008 using the power-law model. The top row shows, from left to right, the observed RGB image, the reconstructed RGB image, the convergence profile, and the magnification model. The next three rows show, from left to right, the observed image, the reconstructed image, the residual, and the reconstructed source for each of the HST filters. The three filters are F160W (second row), F814W (third row), and F475X (fourth row). All the scale bars in each panel correspond to 1″. The star symbol in the reconstructed source panels marks the position of the quasar host galaxy’s centroid.
Current usage metrics show cumulative count of Article Views (full-text article views including HTML views, PDF and ePub downloads, according to the available data) and Abstracts Views on Vision4Press platform.
Data correspond to usage on the plateform after 2015. The current usage metrics is available 48-96 hours after online publication and is updated daily on week days.
Initial download of the metrics may take a while.