Fig. 22.
Download original image
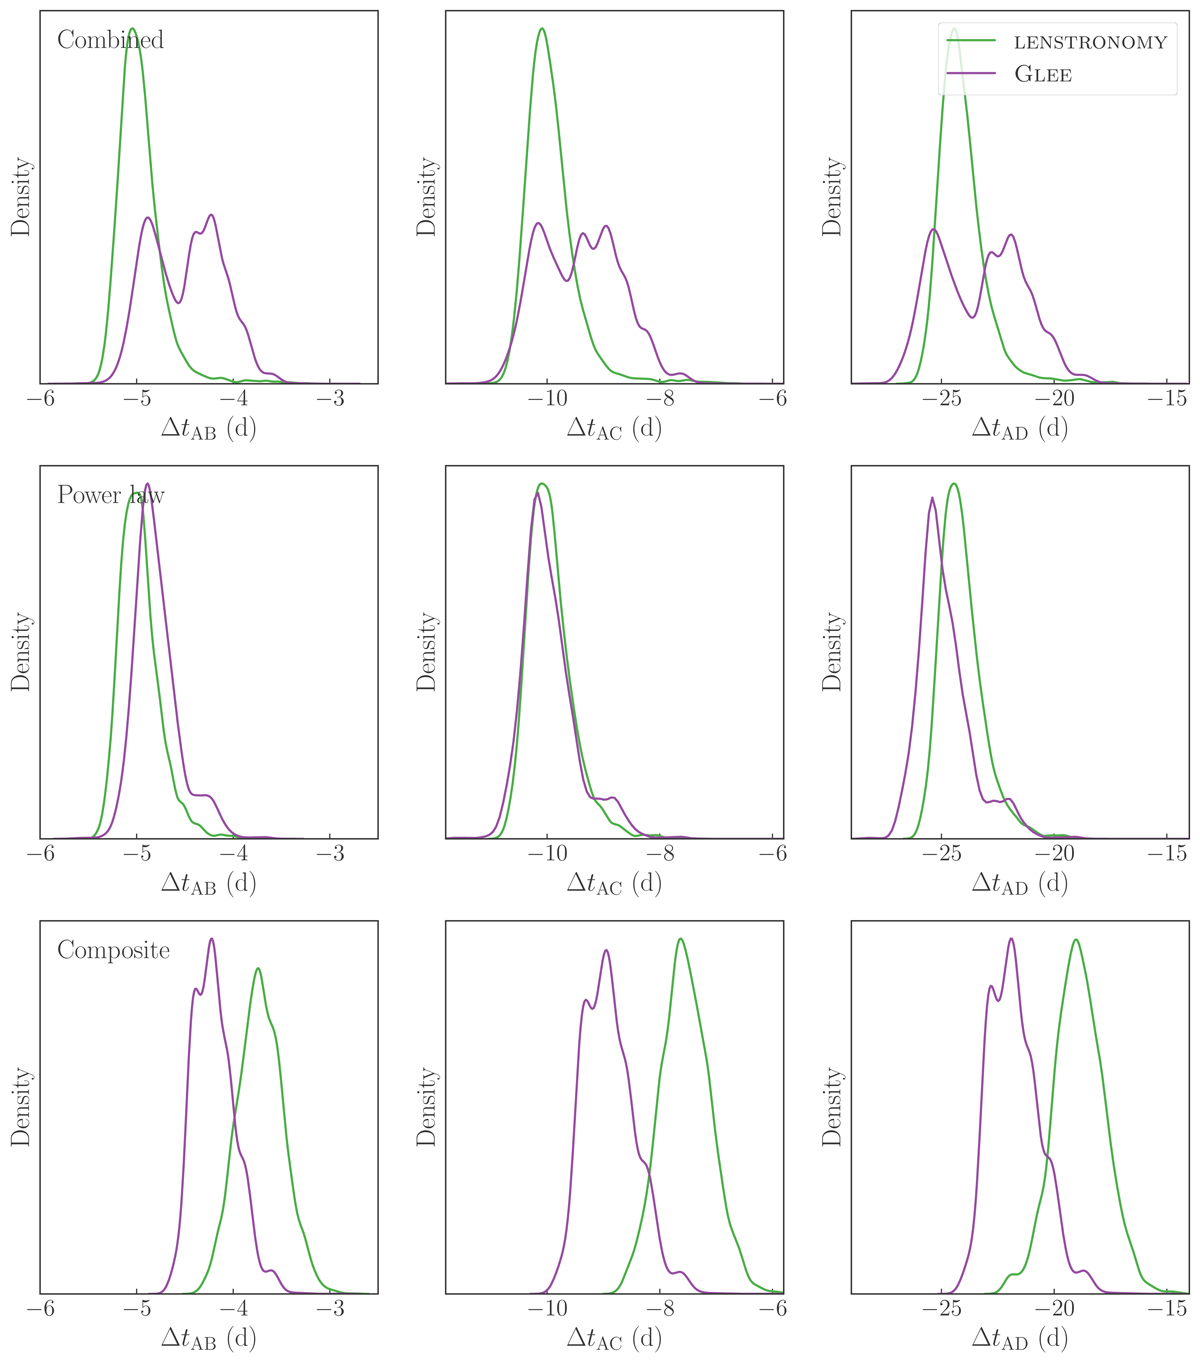
Comparison of predicted time delays between the LENSTRONOMY (green) and GLEE (purple) teams. The three rows show the comparison for combined (top), power-law-only (middle), and composite-only (bottom) cases. The combined posteriors are consistent within < 1.2σ, the power-law model’s posteriors are consistent within < 0.6σ, and the composite model’s posteriors are consistent within < 2.1σ. In percentage, the maximum deviation for the power-law model is between AB image pair by 3.4%, and for the composite model is between AC image pair by 15%. The GLEE team combined the power-law and composite model posteriors with equal weighting after applying the kinematics weighting within each model family, whereas the LENSTRONOMY team combined the two model families with kinematics weighting, leading to the final combined posterior being dominated by the power-law model.
Current usage metrics show cumulative count of Article Views (full-text article views including HTML views, PDF and ePub downloads, according to the available data) and Abstracts Views on Vision4Press platform.
Data correspond to usage on the plateform after 2015. The current usage metrics is available 48-96 hours after online publication and is updated daily on week days.
Initial download of the metrics may take a while.