Fig. 2.
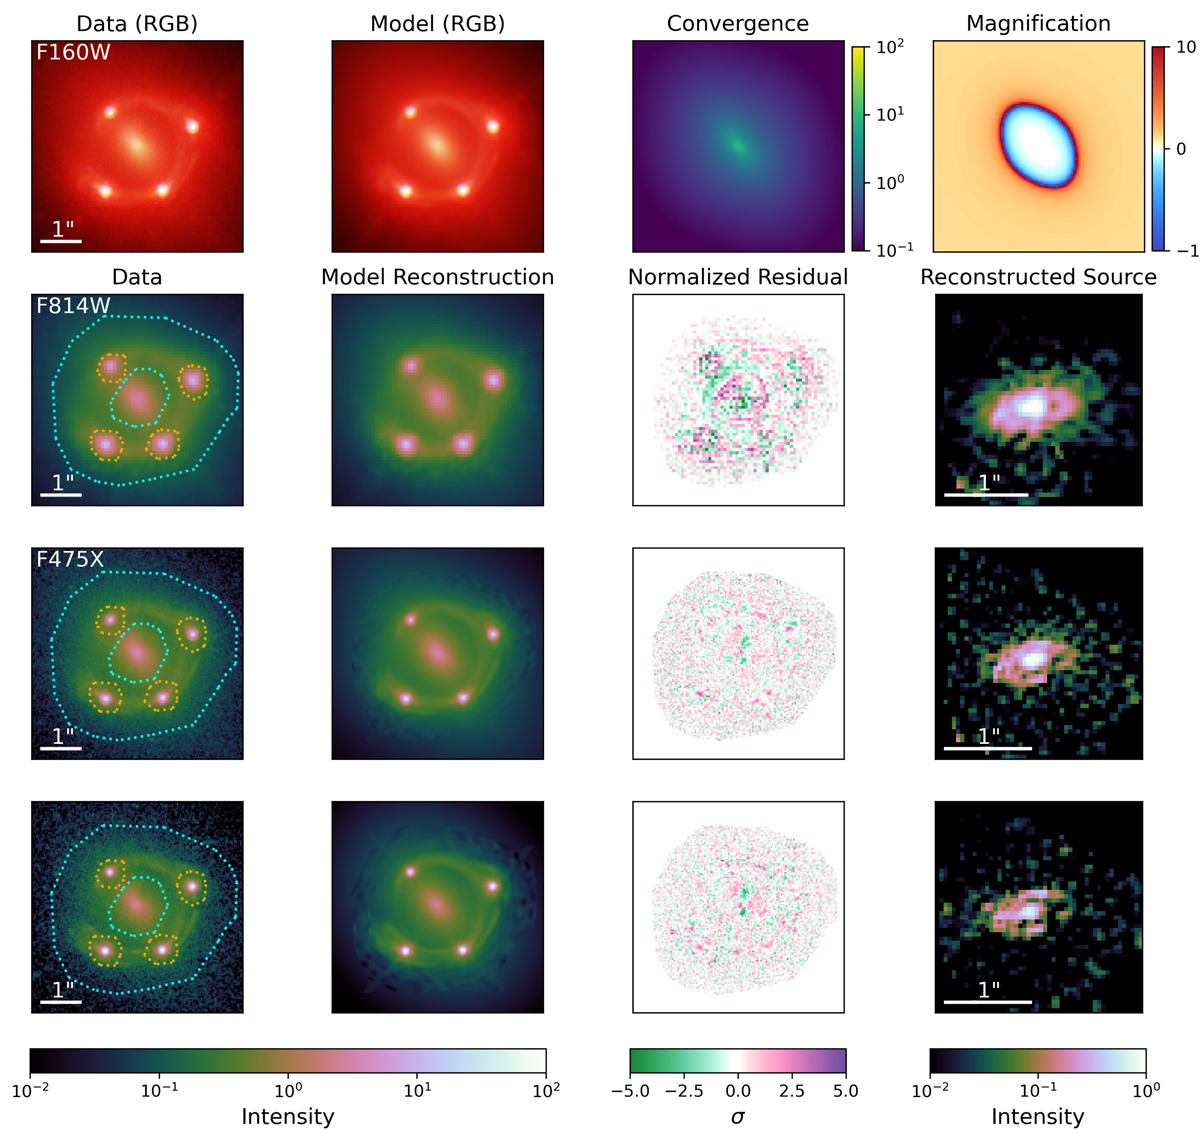
Download original image
Fiducial power-law model results for IR/F160W (top row), UVIS/F814W (middle row), and UVIS/F475X (bottom row) from GLEE. The maximum-likelihood model in the MCMC chain is shown. Shown are the observed image (first column), the reconstructed image predicted by the model (second column), the normalized residual within and interior to the arcmask region (defined as the difference between the data and model, normalized by the estimated uncertainty of each pixel; third column), and the reconstructed source (right column). First column: the dotted cyan lines indicate the arcmask (donut-shaped) region used for fitting the extended source, the dotted orange lines indicate the AGN mask region where the power-law weighting is applied, and the region outside the dotted cyan arcmask is used to further constrain the foreground lens light and (partly) the AGN light (but not the AGN host galaxy light since its corresponding lensed arcs are below the noise level in this outer region). The colour bars show the scale in the respective panels. The results shown here are for the fiducial power-law model, but the results for the other systematics tests (Sect. 5.3) are qualitatively similar.
Current usage metrics show cumulative count of Article Views (full-text article views including HTML views, PDF and ePub downloads, according to the available data) and Abstracts Views on Vision4Press platform.
Data correspond to usage on the plateform after 2015. The current usage metrics is available 48-96 hours after online publication and is updated daily on week days.
Initial download of the metrics may take a while.