Fig. 16.
Download original image
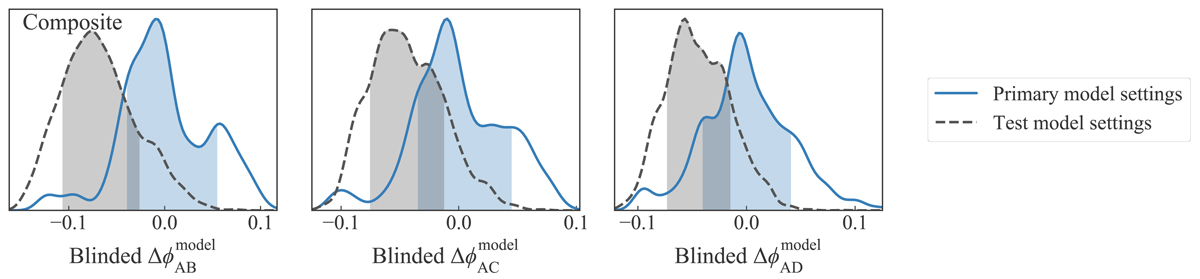
Comparison of the Fermat potential posteriors between two different model settings for the LENSTRONOMY composite model. The blue solid distributions correspond to our primary model settings. In the test model setup (black dashed distributions), we fix the triple Chameleon profile for the stellar mass and light distributions to best fit values from a separately optimized model with the power-law mass profile. We also mask the central region of the deflector galaxy in the test model setup. Additionally, the prior on the halo mass profile is different. Whereas we adopt a prior on the NFW scale radius rs in the primary setup, we adopt a combination of priors on M200 and M⋆ in the test setup. Despite multiple differences in the model settings, the Fermat potential differences are consistent within 1σ with each other.
Current usage metrics show cumulative count of Article Views (full-text article views including HTML views, PDF and ePub downloads, according to the available data) and Abstracts Views on Vision4Press platform.
Data correspond to usage on the plateform after 2015. The current usage metrics is available 48-96 hours after online publication and is updated daily on week days.
Initial download of the metrics may take a while.