Fig. 13.
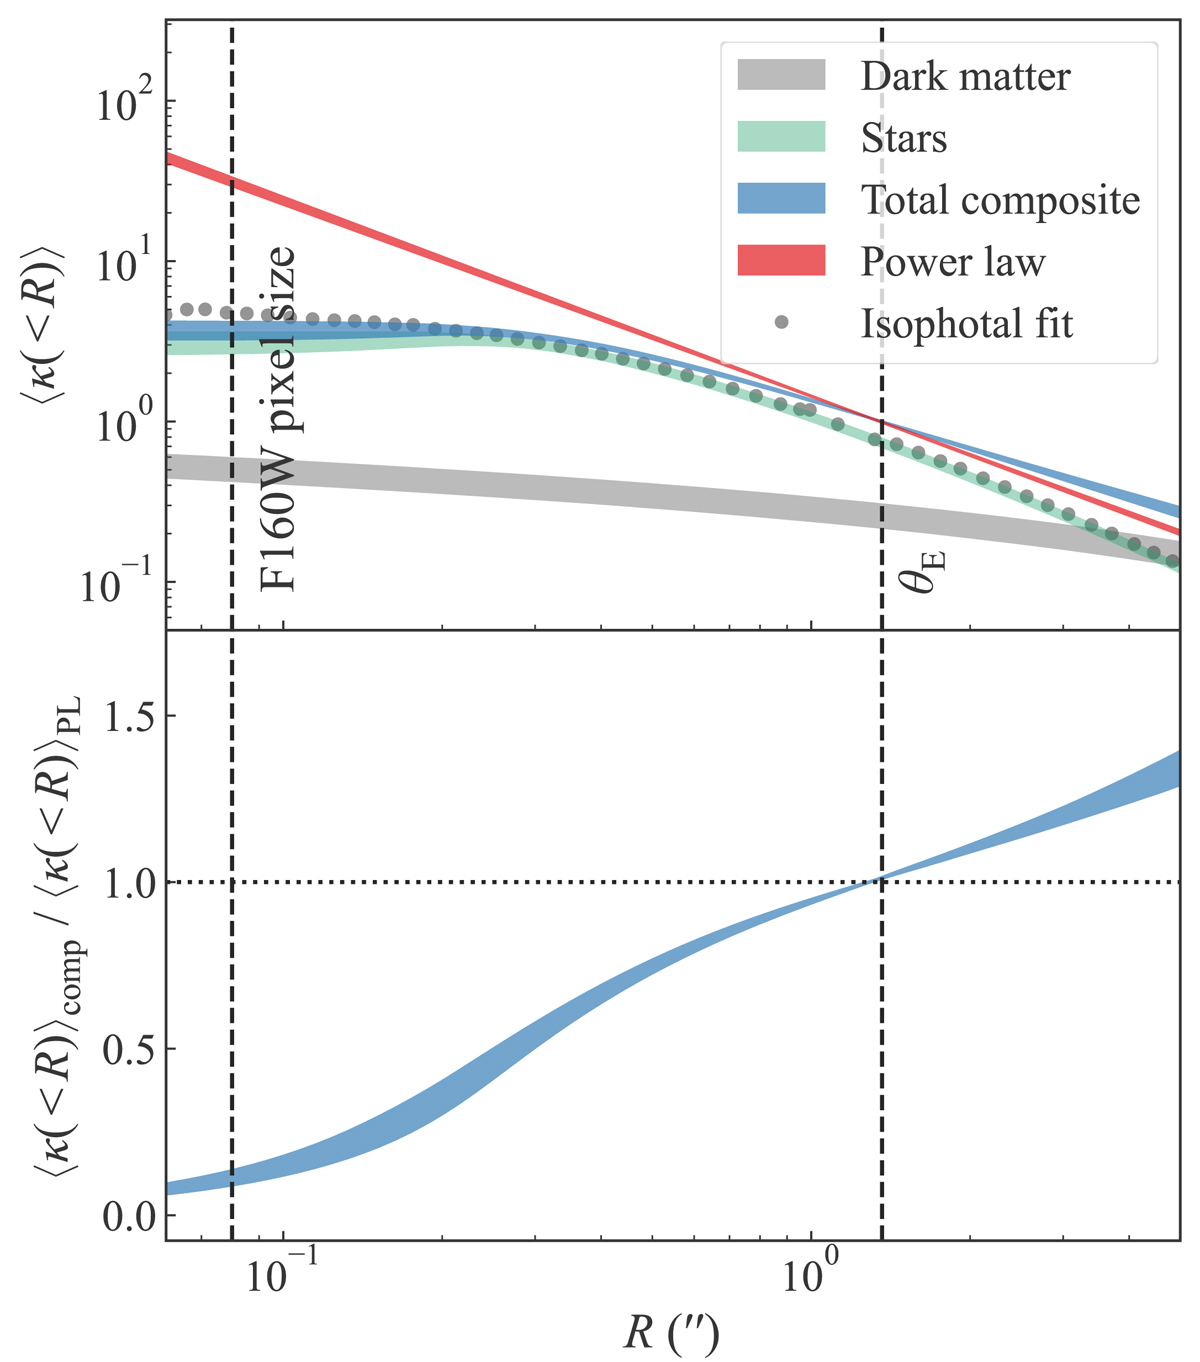
Download original image
Radial mass profiles of the central deflector constrained by the LENSTRONOMY models. Top: circularly averaged convergence ⟨κ(< R)⟩ as a function of radius from LENSTRONOMY power-law (red) and composite (blue) models. The stellar (green) and dark matter (grey) distributions in the composite model are also individually illustrated. The shaded regions encompass the 16th and 84th percentile of the sampled profiles for the corresponding case. The grey points illustrate the surface brightness profile fitted with isophotes as described in Sect. 6.1.1. The amplitude of the isophotal fit is normalized to match with the triple Chameleon profile (green shaded region) at θE for the purpose of this illustration. The vertical black dashed lines mark the pixel size in the F160W band and the best fit Einstein radius. Bottom: ratio of the circularly averaged convergence profiles between the composite and the power-law models. At the Einstein radius the convergence slope deviates by 16−21% between the two model setups.
Current usage metrics show cumulative count of Article Views (full-text article views including HTML views, PDF and ePub downloads, according to the available data) and Abstracts Views on Vision4Press platform.
Data correspond to usage on the plateform after 2015. The current usage metrics is available 48-96 hours after online publication and is updated daily on week days.
Initial download of the metrics may take a while.