Fig. 12.
Download original image
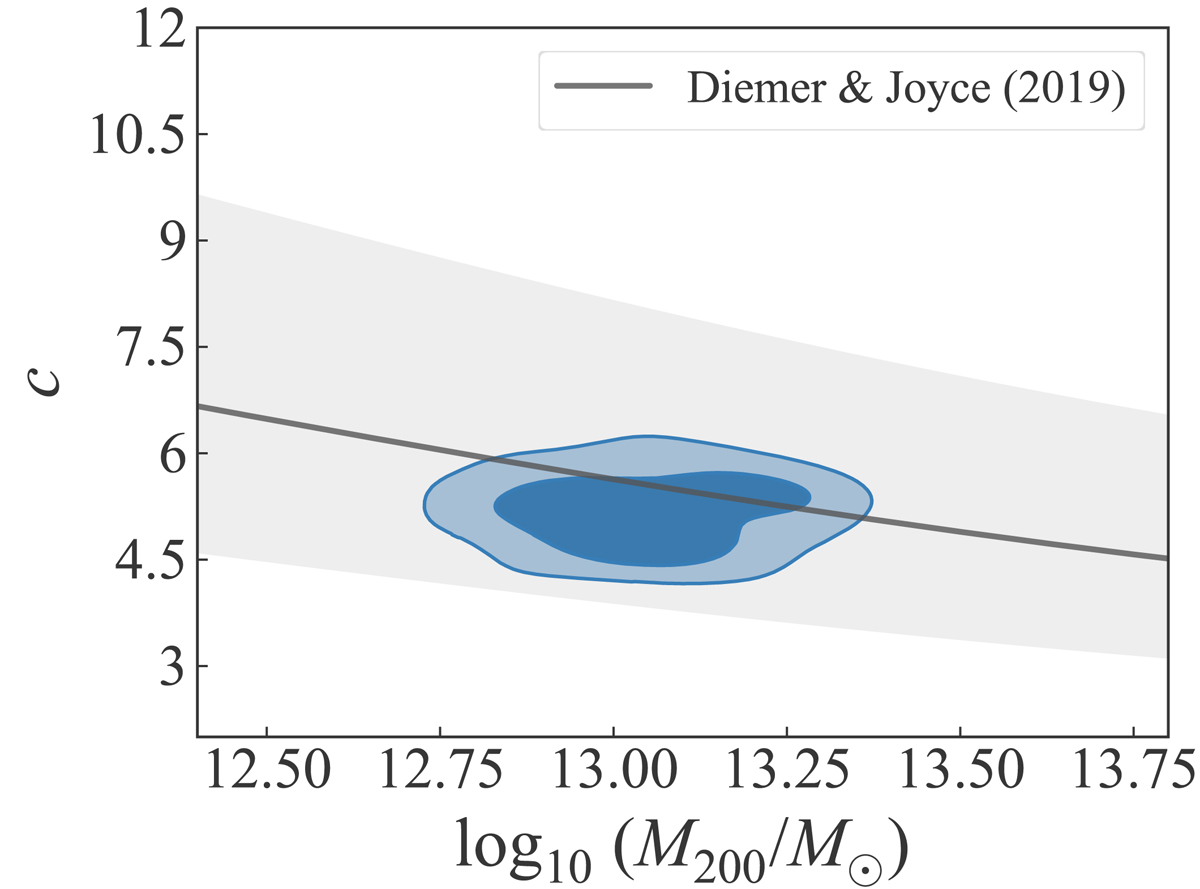
Distribution of M200 and c200 parameters for the NFW halos in LENSTRONOMY composite model (blue shaded region). This distribution is averaged over all the model settings within the composite model family following the procedure described in Sect. 6.3. The 2 contours correspond to the 68% and 95% credible regions, respectively. The black solid line traces the theoretical prediction of the M200 − c200 relation at zd = 0.230 from Diemer & Joyce (2019) with the grey shaded region corresponding to the 68% confidence interval. We adopt this M200 − c relation as a prior in our analysis in addition to a M200 prior based on Sonnenfeld et al. (2018).
Current usage metrics show cumulative count of Article Views (full-text article views including HTML views, PDF and ePub downloads, according to the available data) and Abstracts Views on Vision4Press platform.
Data correspond to usage on the plateform after 2015. The current usage metrics is available 48-96 hours after online publication and is updated daily on week days.
Initial download of the metrics may take a while.