Fig. 10.
Download original image
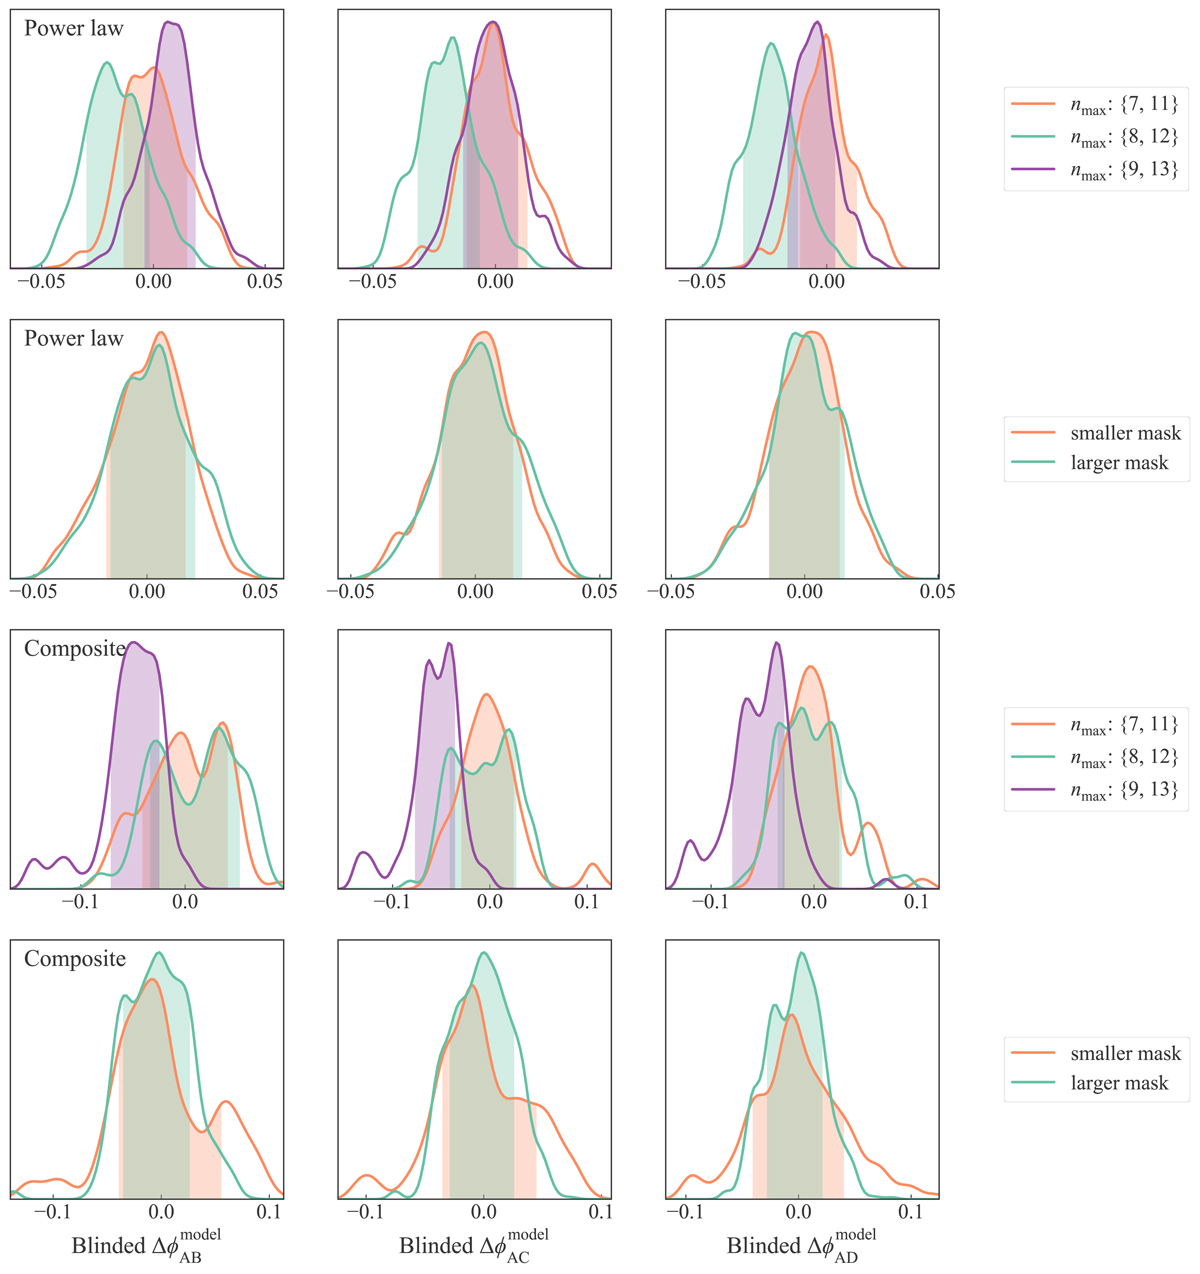
Comparison between the Fermat potential difference posteriors from different LENSTRONOMY model settings. The posterior for a particular setting is obtained by averaging over models that differ in the other model settings, but within a particular model family using the procedure described in Sect. 6.3. Top two rows: correspond to the power-law mass model families, and bottom two rows: correspond to the composite mass model families. The shaded regions illustrate the 68% credible regions. The posteriors are blinded by ![]() , where the ‘ref’ subscript refers to one of the compared models. The potential differences are consistent within 1σ between our adopted choices of model settings.
, where the ‘ref’ subscript refers to one of the compared models. The potential differences are consistent within 1σ between our adopted choices of model settings.
Current usage metrics show cumulative count of Article Views (full-text article views including HTML views, PDF and ePub downloads, according to the available data) and Abstracts Views on Vision4Press platform.
Data correspond to usage on the plateform after 2015. The current usage metrics is available 48-96 hours after online publication and is updated daily on week days.
Initial download of the metrics may take a while.