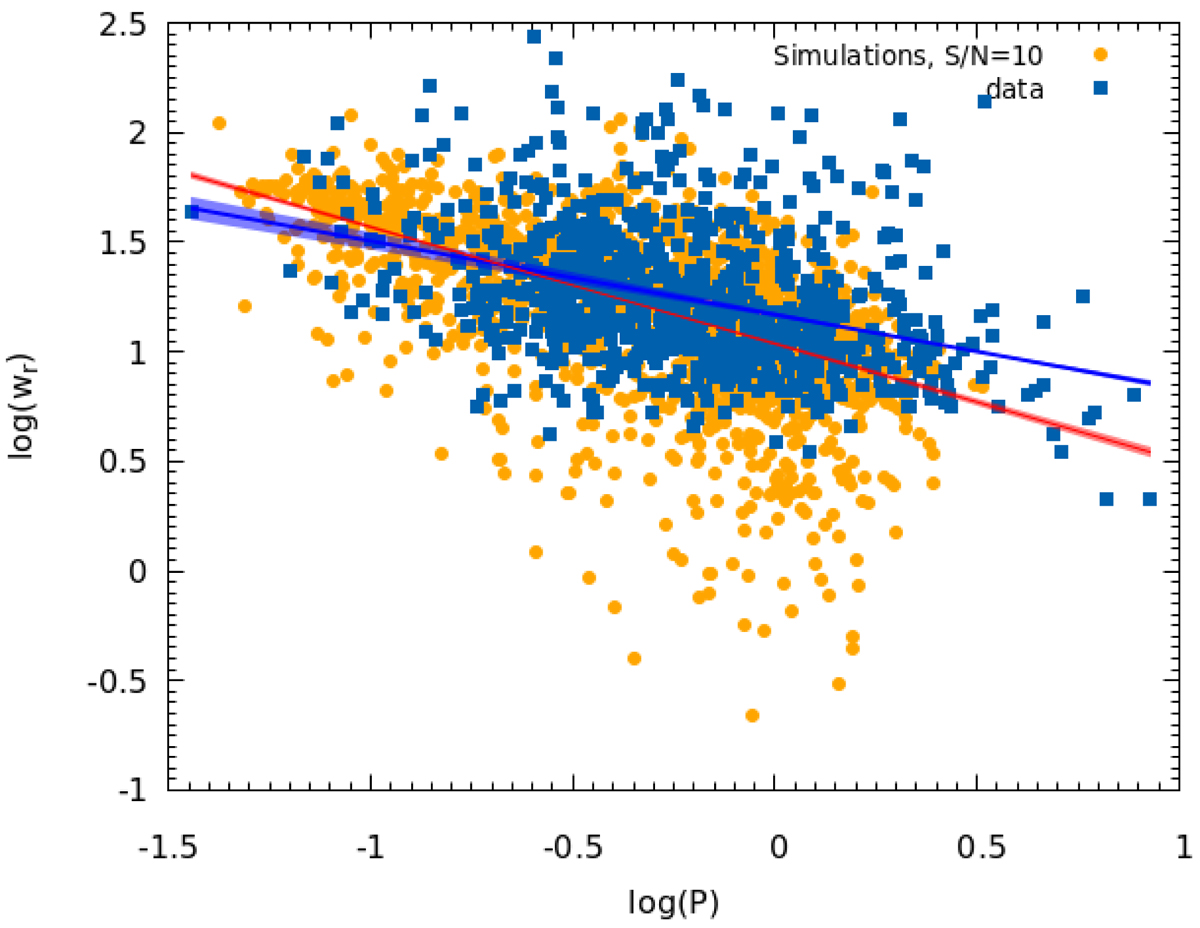
Fig. 10.
Download original image
log(wr) as a function of log(P). The quantity wr is expressed in degrees and P is expressed in s. The data are the width at the 10% level taken from Posselt et al. (2021). The solid blue line and the shaded area represent the result of a linear fit to the data and its uncertainties, and the solid red line and the shaded area represent a linear fit to the simulations, with its uncertainties.
Current usage metrics show cumulative count of Article Views (full-text article views including HTML views, PDF and ePub downloads, according to the available data) and Abstracts Views on Vision4Press platform.
Data correspond to usage on the plateform after 2015. The current usage metrics is available 48-96 hours after online publication and is updated daily on week days.
Initial download of the metrics may take a while.