Open Access
Fig. E.1.
Download original image
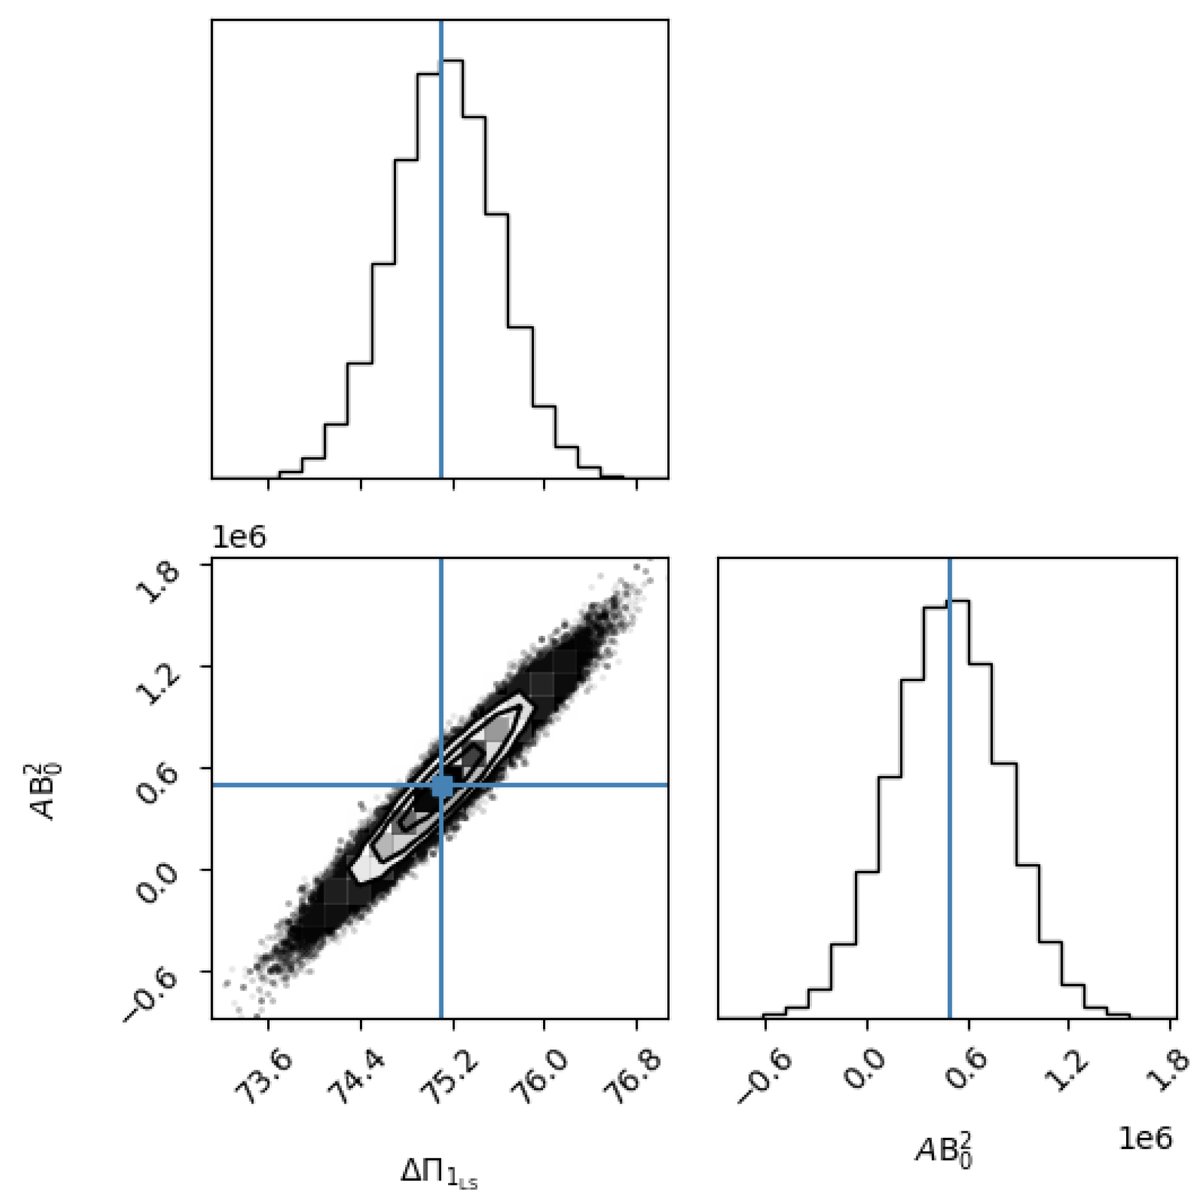
Corner plot showing the posterior distribution of ΔΠ1 and ![]() obtained from the magnetized Bayesian fit (Eq. 38). Blue lines indicate the starting values from the
obtained from the magnetized Bayesian fit (Eq. 38). Blue lines indicate the starting values from the ![]() fit.
fit.
Current usage metrics show cumulative count of Article Views (full-text article views including HTML views, PDF and ePub downloads, according to the available data) and Abstracts Views on Vision4Press platform.
Data correspond to usage on the plateform after 2015. The current usage metrics is available 48-96 hours after online publication and is updated daily on week days.
Initial download of the metrics may take a while.