Fig. 5.
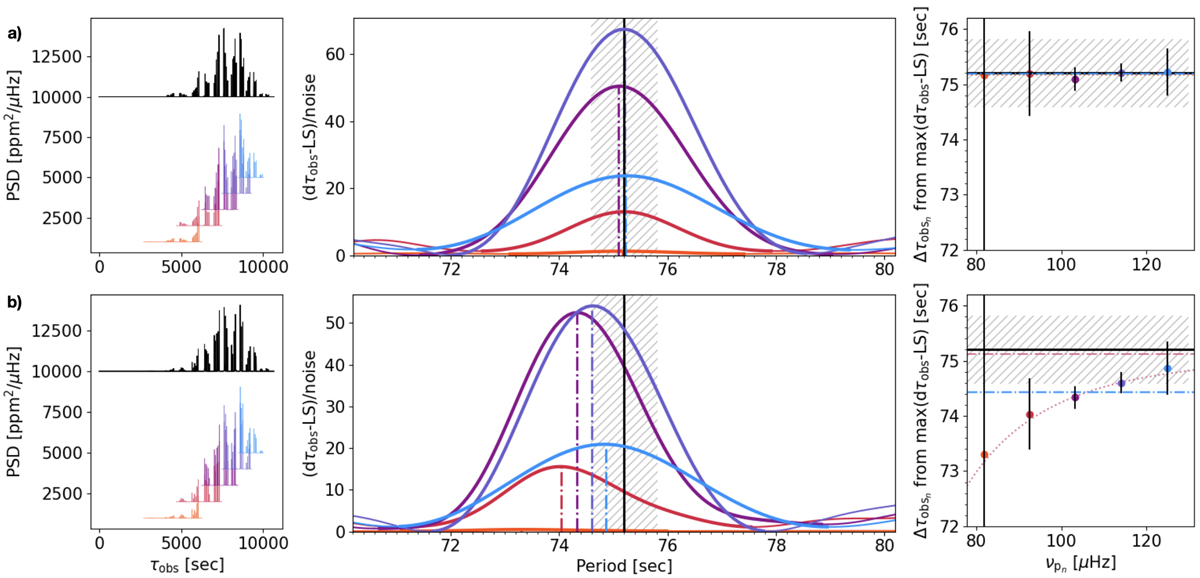
Download original image
Method to retrieve ΔΠ1. a) Non-rotating, non-magnetized model as in the first panel of Fig. 1. b) Non-rotating, magnetized model as in the third panel of Fig. 1. In each case, left panels represent the stretched PSD according to the dτobs variable (Eq. (15)). Subsamples centered around the p-m modes with a width of 2 − Δν are extracted and plotted in different colors below one another. Vertical positions are chosen so that data do not overlap too much, they are therefore arbitrary. Middle panels: a zoom around the dominant peak in the normalized dτobs-LS periodogram associated with the different frequency ranges color-coded on left panels. Curves are thicker within the central peak for better visualization. Vertical dot-dashed lines indicate the measurement of Δτobsn on the various frequency ranges. Hatched areas indicate the typical uncertainty δ(ΔΠ1)res = 0.6 s on the measurement of ΔΠ1 from LS-based methods according to the study of Vrard et al. (2016), centered around ΔΠ1 = 75.2 s (same in the right panels). Right panels such local measurements of Δτobsn are transferred as a function of the central p-m frequencies. The black line indicates the true value of ΔΠ1 and the blue dash-dotted line indicates Δτobs. In the bottom panel, the dotted pink curve is the result of the Bayesian fit of the ΔΠ1 − νpm law according to Eq. (38), and the pink dash-dotted line indicates the measurement of ΔΠ1 obtained from the fitting process (see Table 1).
Current usage metrics show cumulative count of Article Views (full-text article views including HTML views, PDF and ePub downloads, according to the available data) and Abstracts Views on Vision4Press platform.
Data correspond to usage on the plateform after 2015. The current usage metrics is available 48-96 hours after online publication and is updated daily on week days.
Initial download of the metrics may take a while.