Fig. 4.
Download original image
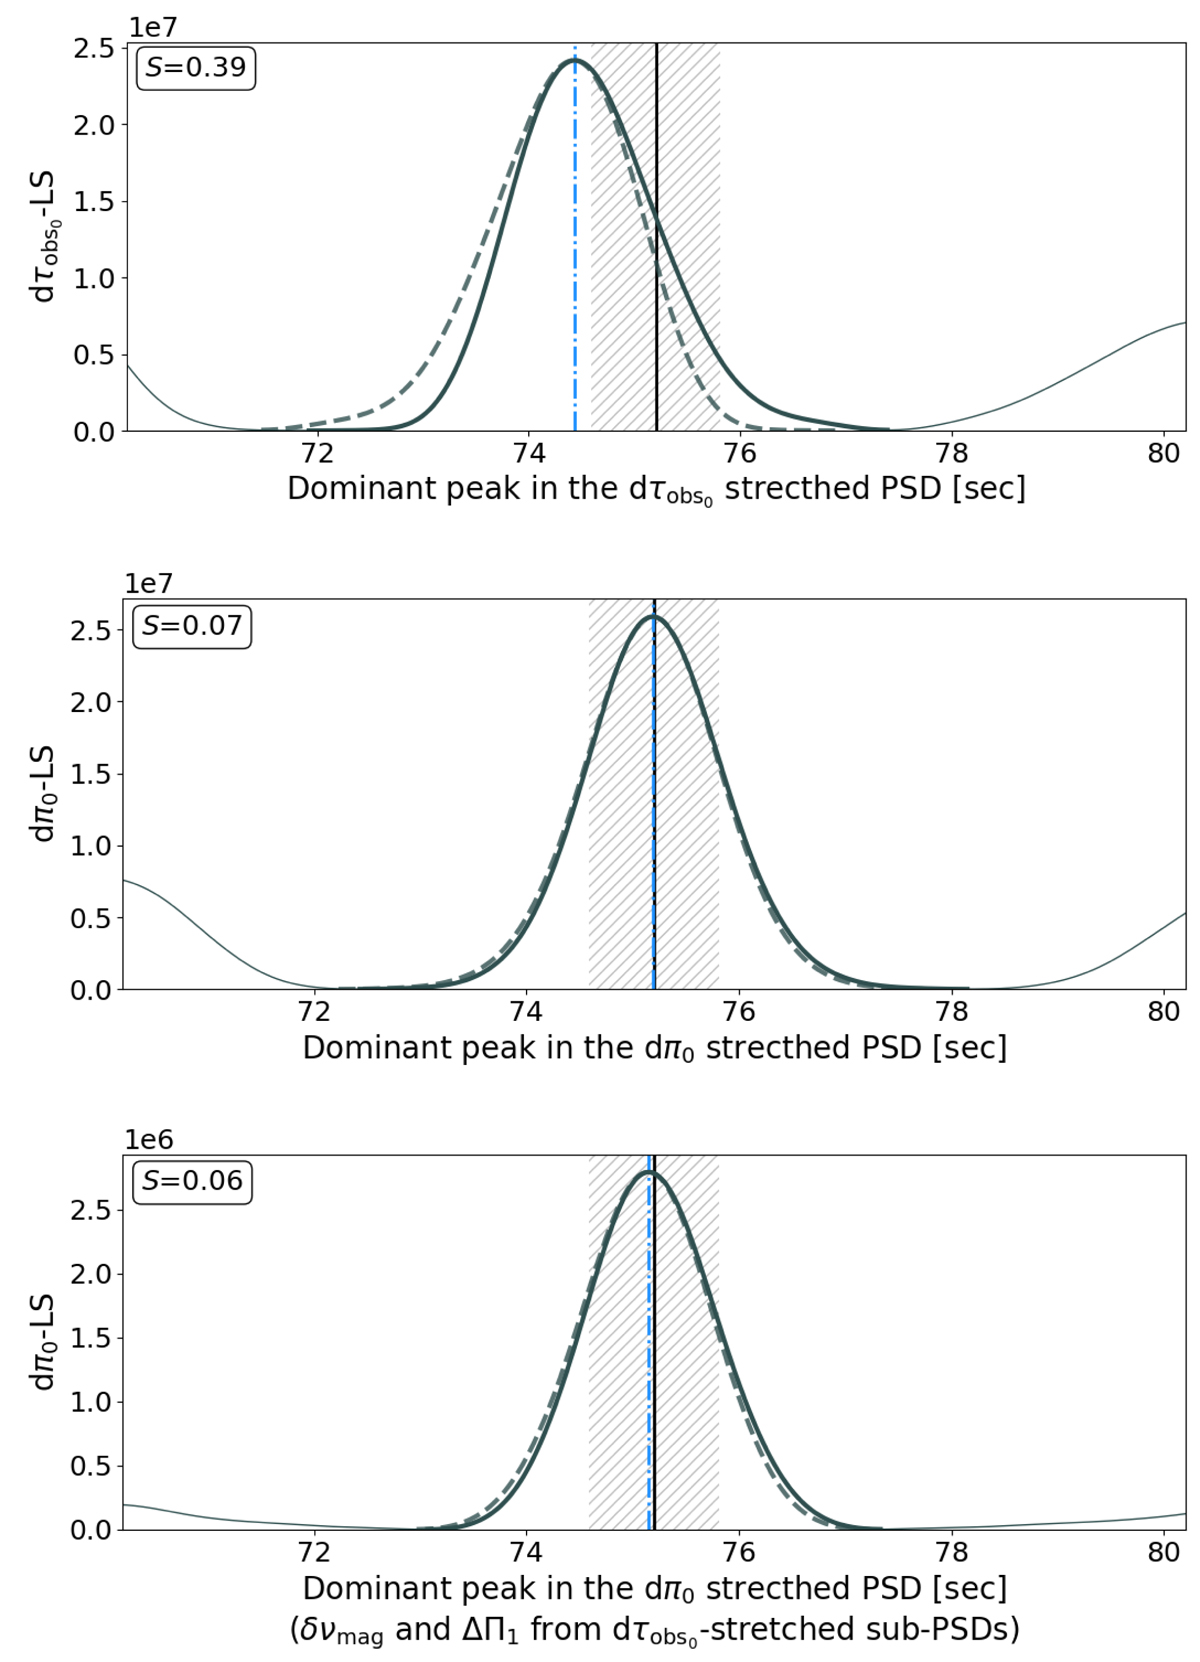
LS periodograms for simulated stars. Top panel: LS periodogram of the dτobsm-stretched PSD for a simulated magnetized RG observed pole-on. Middle panel: dπ0-LS periodogram for the simulated magnetized RG, using ΔΠ1 = 75.2 s and δνmag(νmax) = 0.40 μHz. Bottom panel: LS periodogram of the dπ0-stretched PSD for the simulated magnetized RG by using ΔΠ1 = 75.13 s and δνmag(νmax) = 0.38 μHz (as calculated in Sect. 4.5). In each panel, the black line indicates the true value of ΔΠ1, and the dot-dashed blue line indicates the period associated with the maximum amplitude in the LS periodogram. Dashed grey curves are the mirrored central peak around the period associated with the maximum amplitude in the LS periodogram. Curves are thicker within the central peak for better visualization. Hatched areas indicate the typical uncertainty δ(ΔΠ1)res = 0.6 s on the measurement of ΔΠ1 from LS-based methods according to the study of Vrard et al. (2016), centered around ΔΠ1 = 75.2 s. The skewness of the dominant peak calculated with Eq. (C.1) is indicated in the top left corner of each panel.
Current usage metrics show cumulative count of Article Views (full-text article views including HTML views, PDF and ePub downloads, according to the available data) and Abstracts Views on Vision4Press platform.
Data correspond to usage on the plateform after 2015. The current usage metrics is available 48-96 hours after online publication and is updated daily on week days.
Initial download of the metrics may take a while.