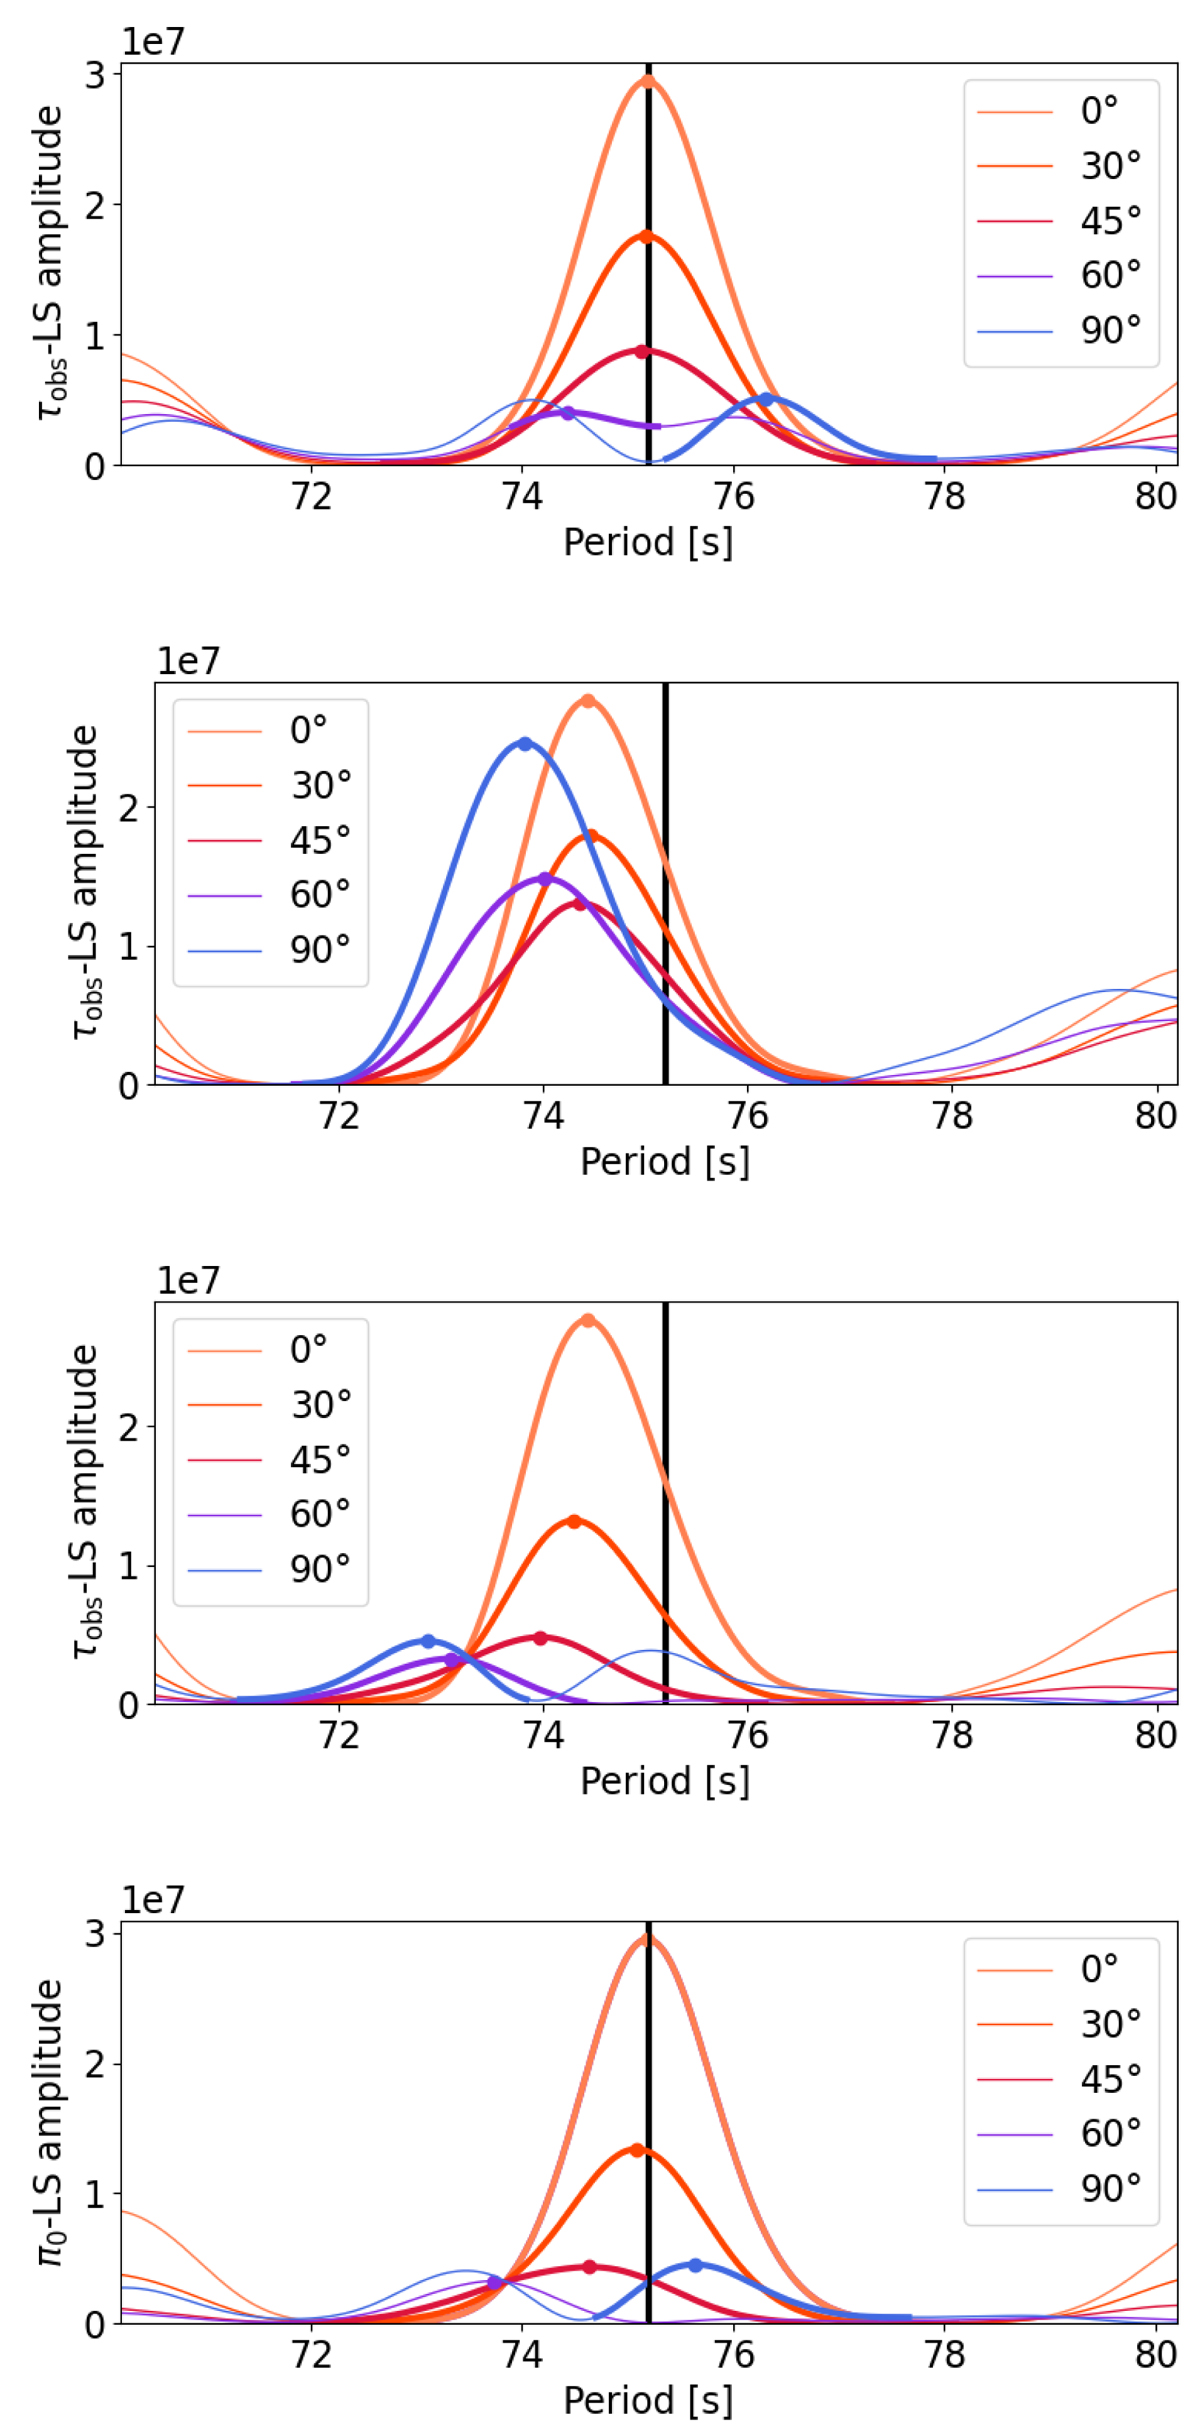
Fig. 2.
Download original image
LS periodograms for different stellar models. Top panel: dτobs-LS periodogram for a simulated star rotating such as δνrot, g = 0.69 μHz. Second panel: same diagram for a simulated magnetized, non-rotating star such as δνmag, g(νmax) = 0.4 μHz. Third panel: same diagram for a simulated magnetized and rotating star such as δνrot, g = 0.69 μHz and δνmag, g(νmax) = 0.4 μHz. Bottom panel: dπ0-LS periodogram of the same rotating and magnetized star. In each panel, the star is observed with various inclination angles with respect to the rotation axis of the star following the color code in the legend. LS periodogram are zoomed around the true value of the period spacing ΔΠ1 = 75.2 s.
Current usage metrics show cumulative count of Article Views (full-text article views including HTML views, PDF and ePub downloads, according to the available data) and Abstracts Views on Vision4Press platform.
Data correspond to usage on the plateform after 2015. The current usage metrics is available 48-96 hours after online publication and is updated daily on week days.
Initial download of the metrics may take a while.