Fig. 1.
Download original image
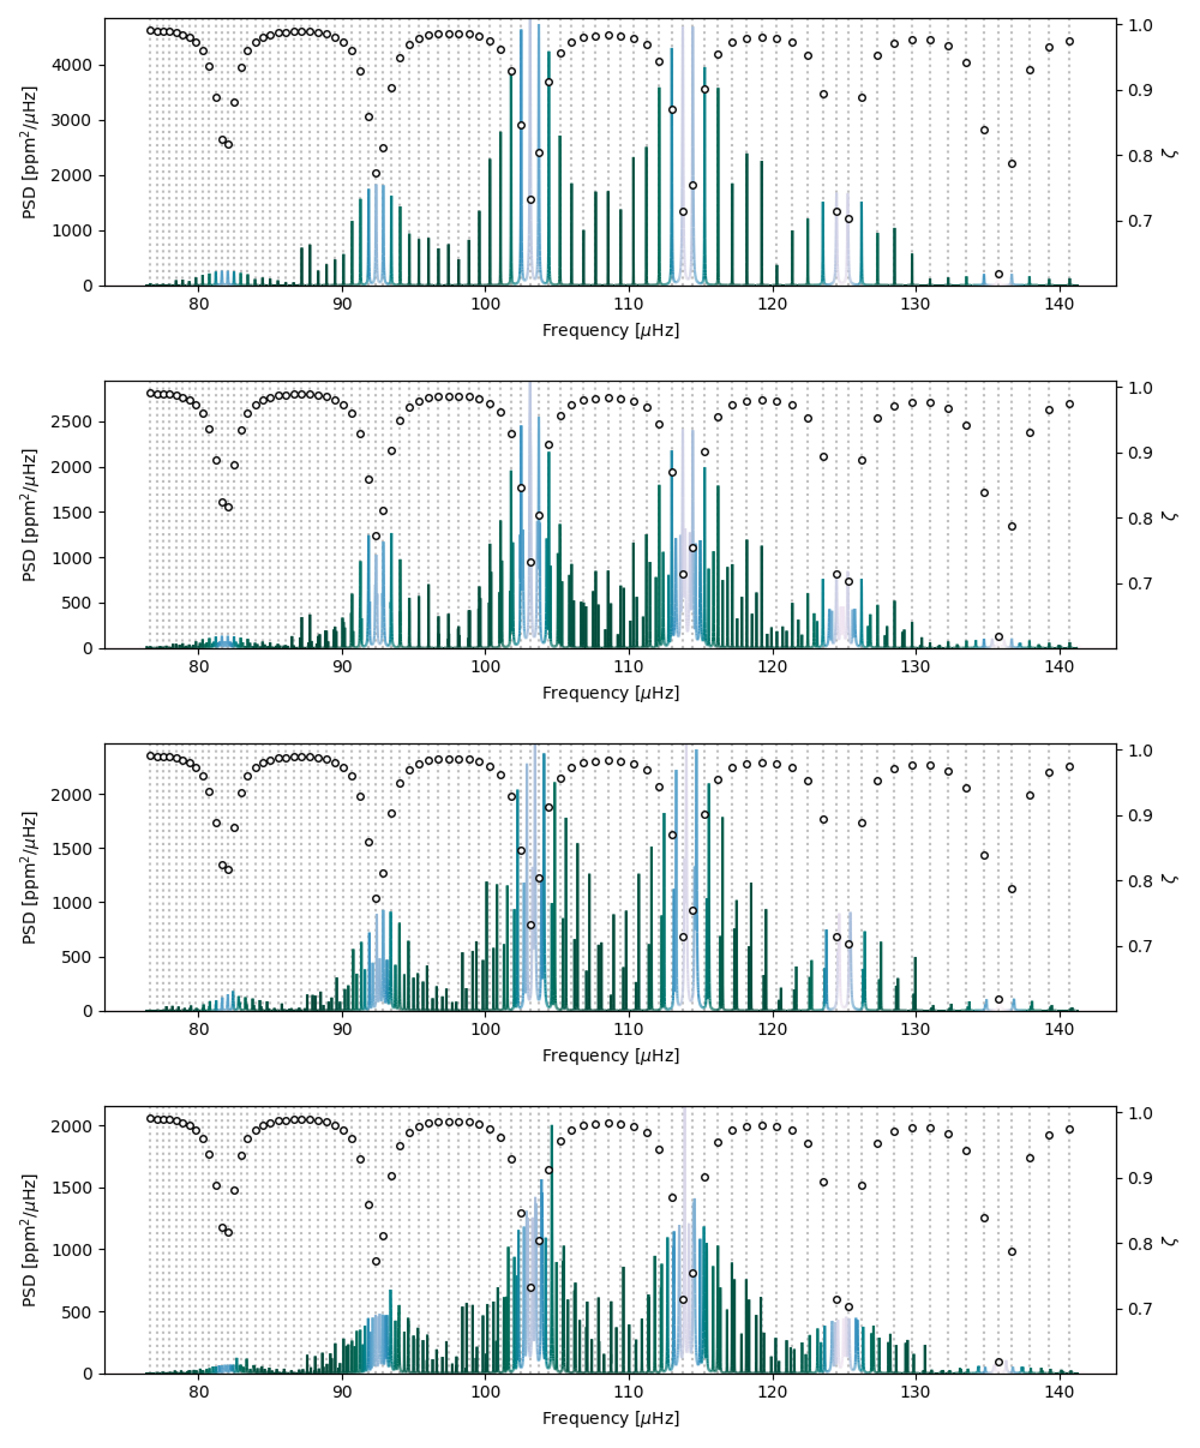
PSDs comprised of mixed dipolar oscillation modes of a simulated RGB star with νmax = 110 μHz and ΔΠ1 = 75.2 s. Top panel: non-rotating, non-magnetized model. Second panel: model rotating with δνrot = 0.69 μHz, i = 45°. Third panel: model agnetized with δνmag(νmax) = 50δfres = 0.4 μHz, i = 45°. Bottom panel: model rotating and magnetized with δνrot = 0.69 μHz, δνmag(νmax) = 0.4 μHz, i = 45°. The ζ function is overplotted on each panel to indicate the location of p-m modes (dips) and g-m modes (maxima), while the color of the PSD varies according to the zeta function value for better visualization of the nature of the modes (dark green: g-m dipolar modes, light blue: p-m dipolar modes). Dotted vertical lines indicate the location of the modes for the non-rotating, non-magnetized model.
Current usage metrics show cumulative count of Article Views (full-text article views including HTML views, PDF and ePub downloads, according to the available data) and Abstracts Views on Vision4Press platform.
Data correspond to usage on the plateform after 2015. The current usage metrics is available 48-96 hours after online publication and is updated daily on week days.
Initial download of the metrics may take a while.