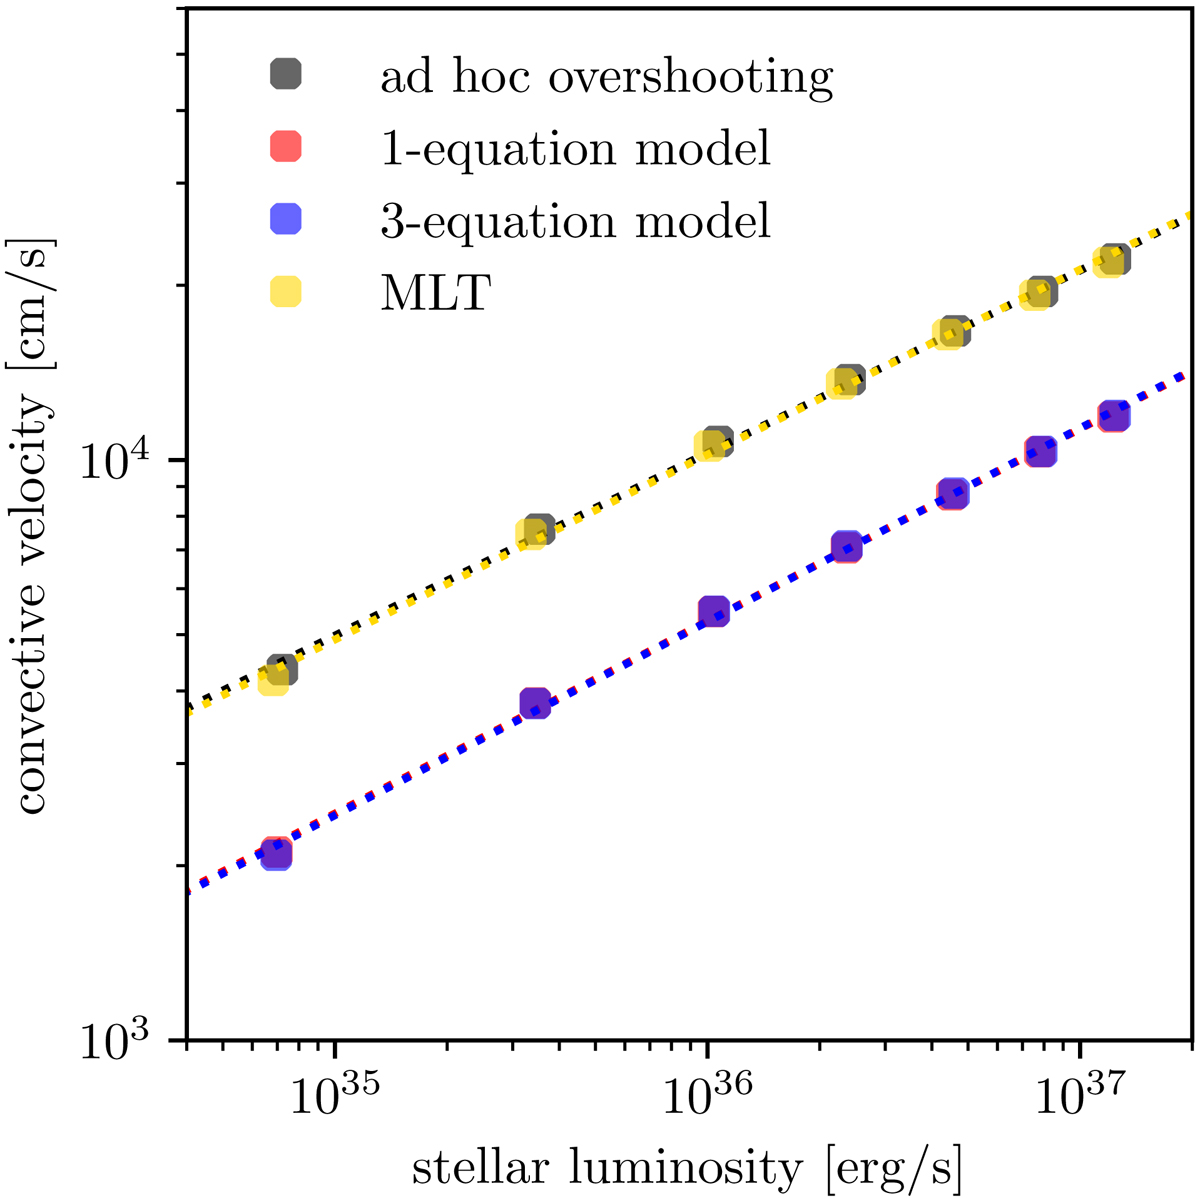
Fig. 8.
Download original image
Comparison of the maximum convective velocities for different convection models as a function of stellar luminosity. For the Kuhfuß model, the isotropic convective velocity, vc,iso, is plotted. The dotted lines indicate a linear fit to the logarithmic data. We note that the data of the 1- and 3-equation Kuhfuß models (red and blue points, respectively) are largely overlapping, as are the black and yellow dots.
Current usage metrics show cumulative count of Article Views (full-text article views including HTML views, PDF and ePub downloads, according to the available data) and Abstracts Views on Vision4Press platform.
Data correspond to usage on the plateform after 2015. The current usage metrics is available 48-96 hours after online publication and is updated daily on week days.
Initial download of the metrics may take a while.