Fig. 6.
Download original image
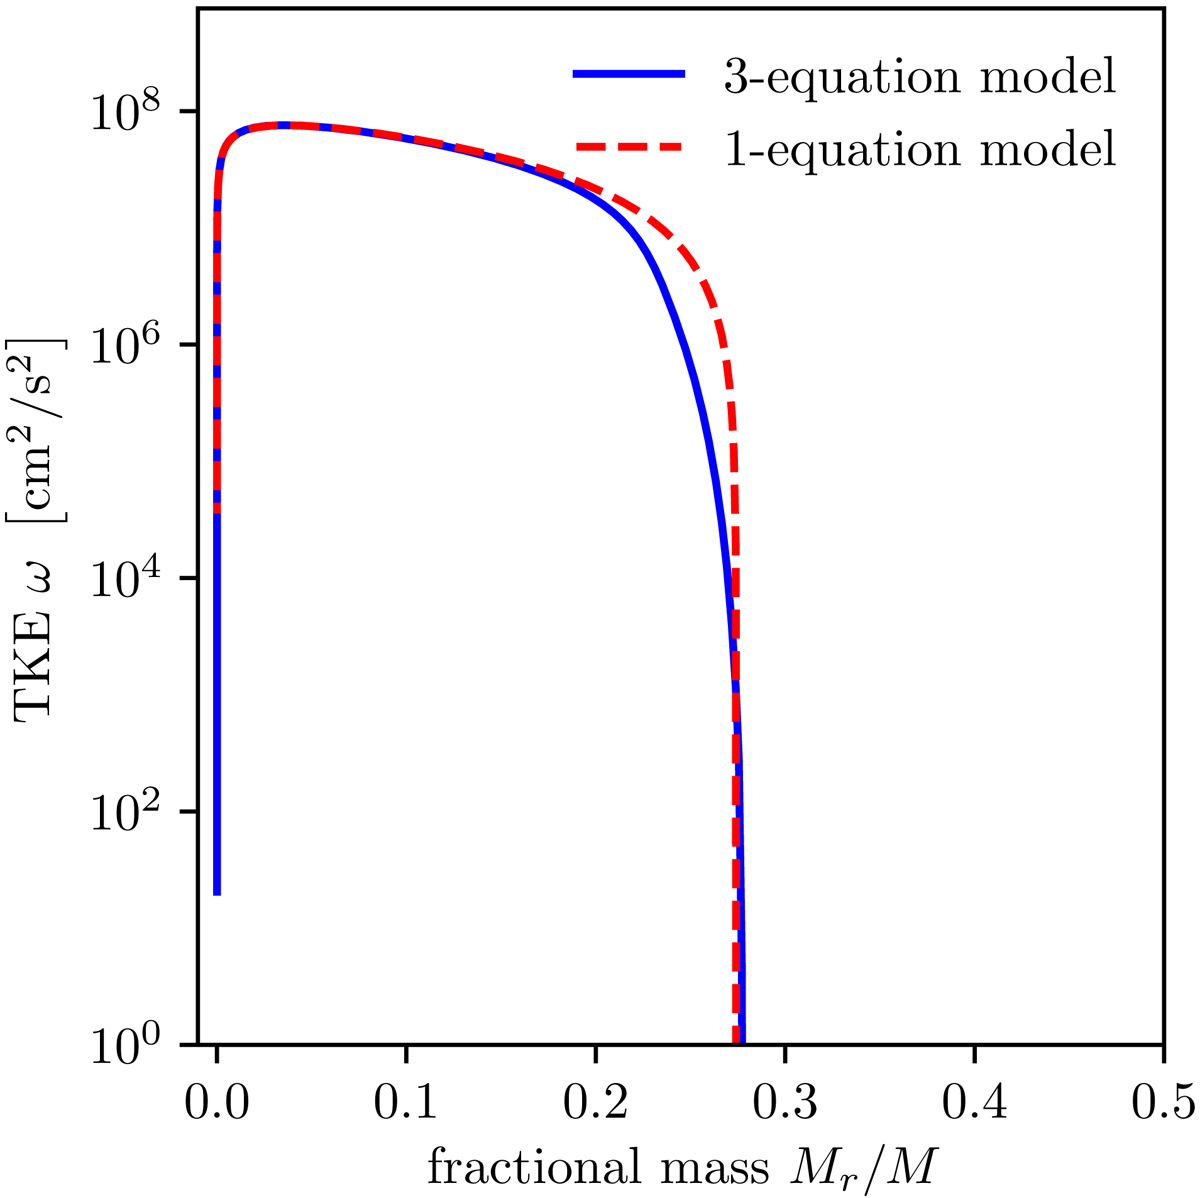
Comparison of the TKE in the 1-equation non-local model and the 3-equation non-local model with an enhanced dissipation rate of TKE in a 5 M⊙ main-sequence model on a logarithmic scale. The models have been selected to have the same central hydrogen abundance as the model in Fig. 1. The 1-equation model computes Λ according to Eq. (10).
Current usage metrics show cumulative count of Article Views (full-text article views including HTML views, PDF and ePub downloads, according to the available data) and Abstracts Views on Vision4Press platform.
Data correspond to usage on the plateform after 2015. The current usage metrics is available 48-96 hours after online publication and is updated daily on week days.
Initial download of the metrics may take a while.