Open Access
Fig. 5.
Download original image
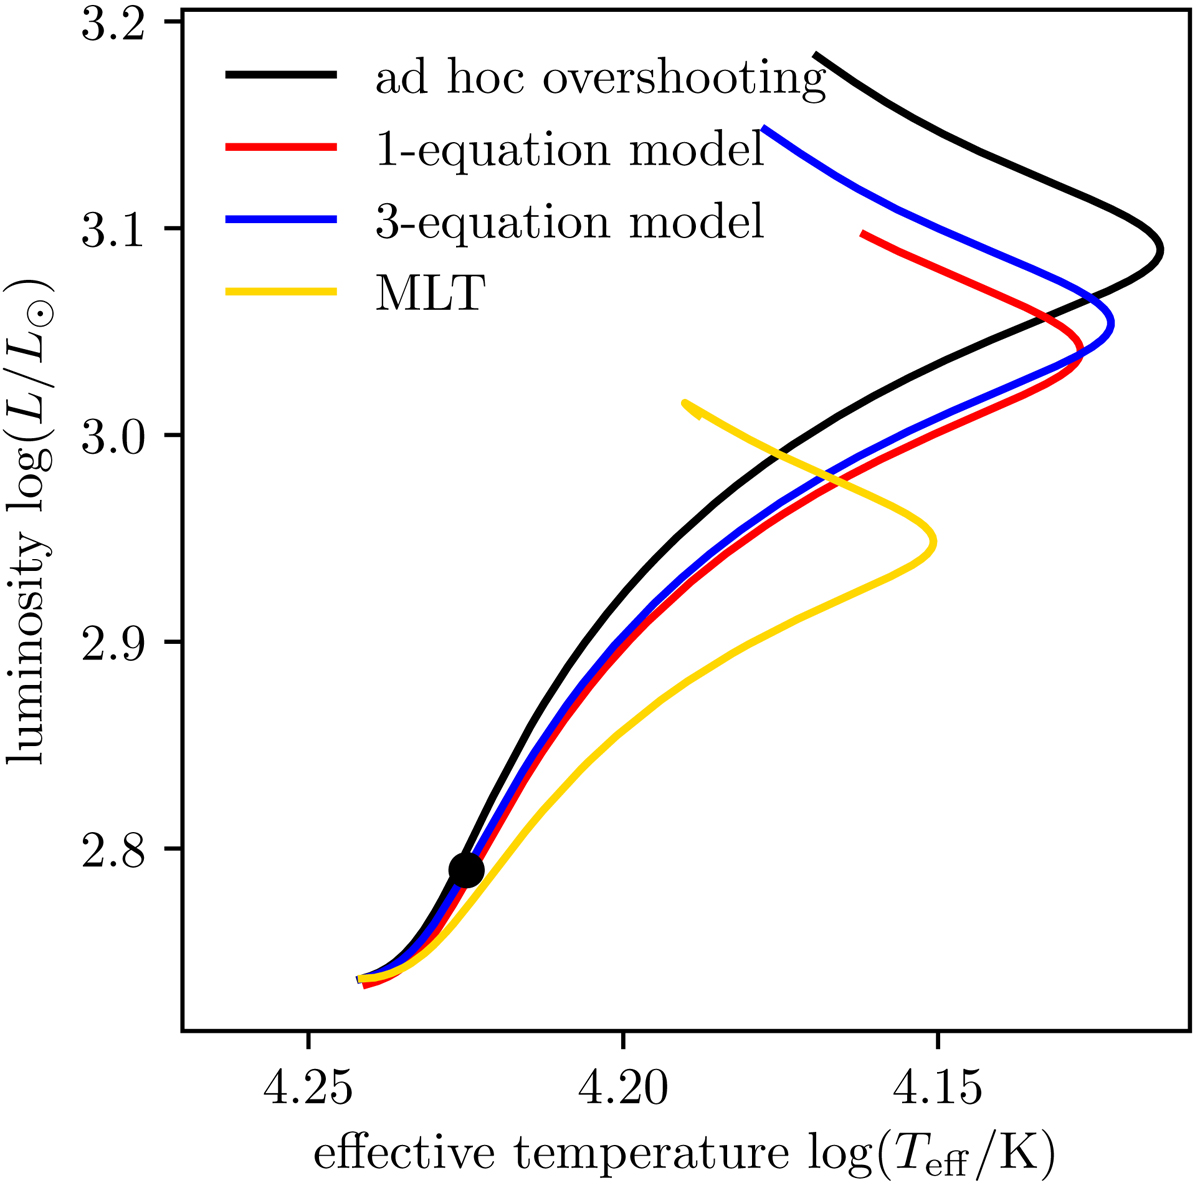
Evolutionary tracks in the Hertzsprung-Russell diagram of a 5 M⊙ model computed with MLT (yellow line), ad hoc overshooting (black line), the 3-equation, non-local model (blue line) and the 1-equation, non-local model (red line). The black dot marks the model selected at a central hydrogen abundance of Xc = 0.6.
Current usage metrics show cumulative count of Article Views (full-text article views including HTML views, PDF and ePub downloads, according to the available data) and Abstracts Views on Vision4Press platform.
Data correspond to usage on the plateform after 2015. The current usage metrics is available 48-96 hours after online publication and is updated daily on week days.
Initial download of the metrics may take a while.