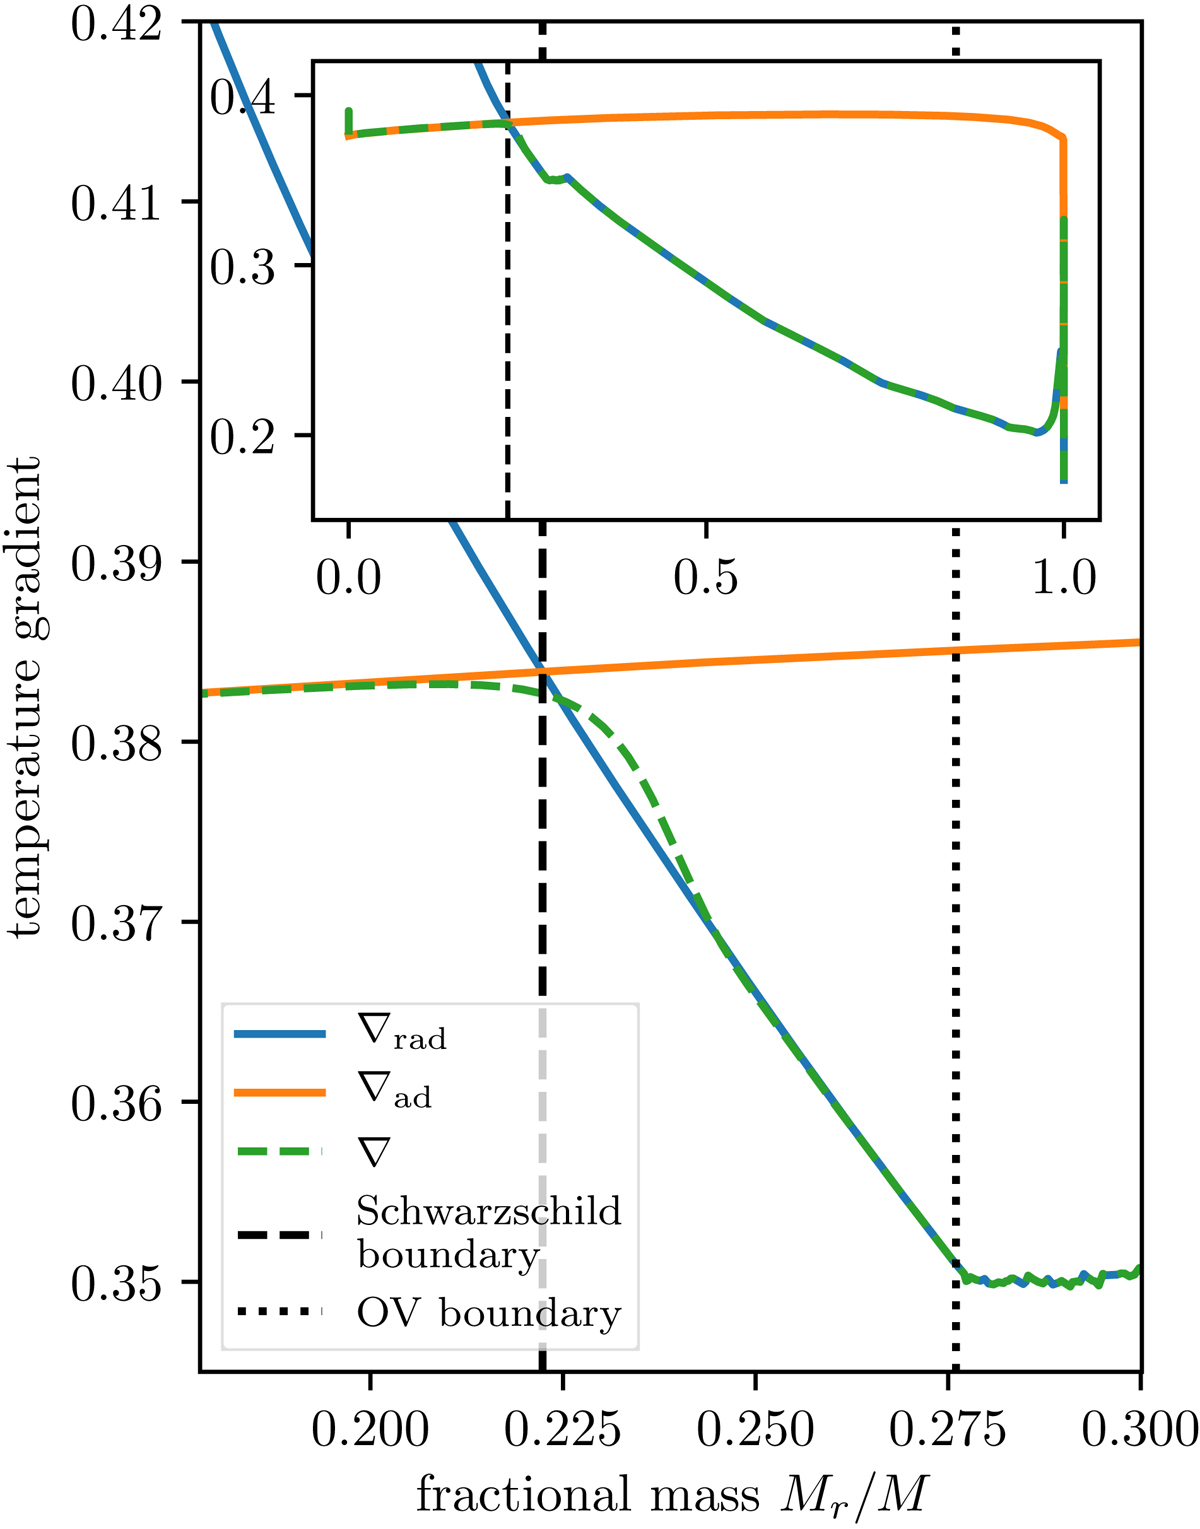
Fig. 3.
Download original image
Temperature gradients in the overshooting zone of the same 5 M⊙ main-sequence model as in Fig. 1. The blue and orange lines indicate the radiative (∇rad) and adiabatic (∇ad) temperature gradients, respectively. The dashed green line indicates the model temperature gradient, ∇, obtained from the 3-equation non-local convection model. The dashed black line indicates the Schwarzschild boundary, while the dotted black line indicates the boundary of the well-mixed overshooting region. The inset shows the three temperature gradients from the centre to the surface of the stellar model. The selected stellar model has a central hydrogen abundance of Xc = 0.6.
Current usage metrics show cumulative count of Article Views (full-text article views including HTML views, PDF and ePub downloads, according to the available data) and Abstracts Views on Vision4Press platform.
Data correspond to usage on the plateform after 2015. The current usage metrics is available 48-96 hours after online publication and is updated daily on week days.
Initial download of the metrics may take a while.