Fig. 10.
Download original image
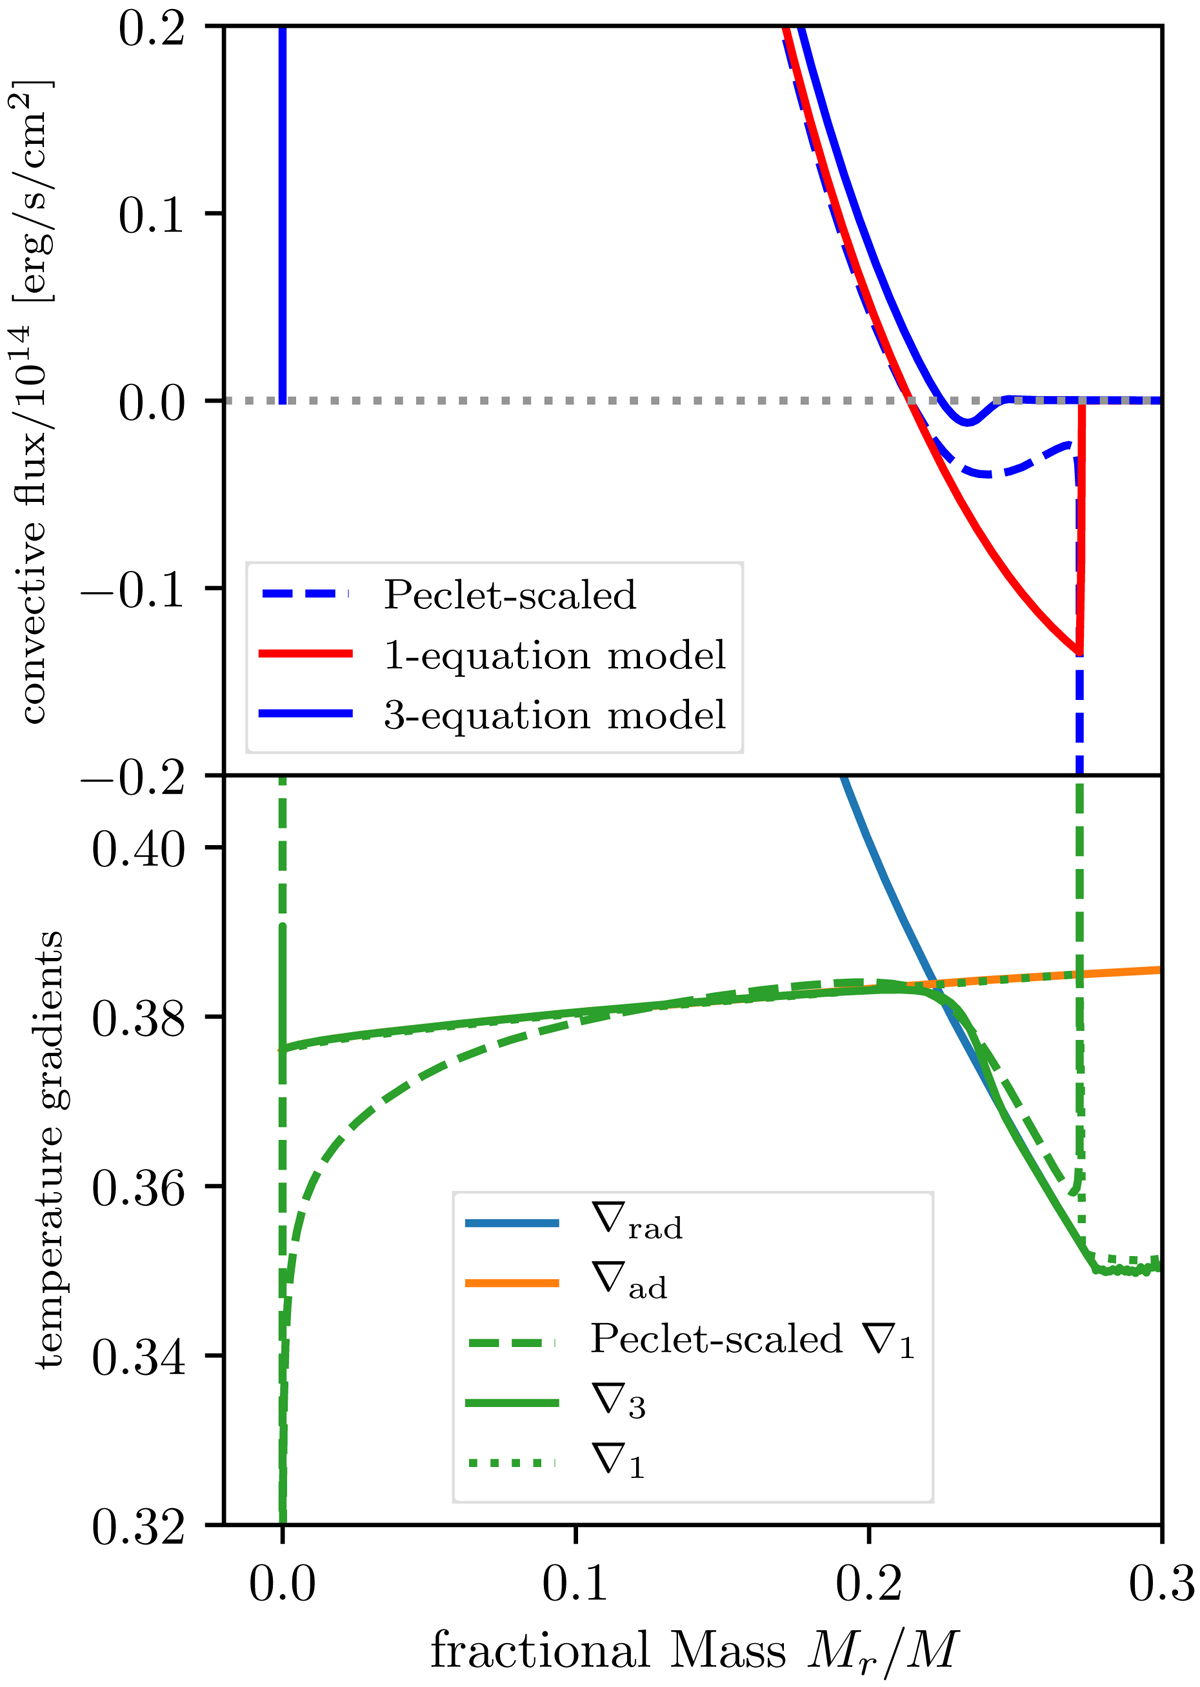
Comparison of convective fluxes and temperature gradients obtained from the Peclet-scaling and the 1- and 3-equation models. Upper panel: convective flux as a function of fractional mass. The red and blue lines show the results obtained from the 1- and 3-equation model, respectively. The dashed blue line indicates the convective flux scaled with the Peclet number according to Eq. (12). Lower panel: temperature gradients as a function of fractional mass. The blue and orange lines indicate the radiative and adiabatic temperature gradient, respectively. The dotted and solid green lines indicate the temperature gradient as obtained by the 1- and 3-equation models. The dashed green line shows the temperature gradient of the 1-equation model computed from the scaled convective flux shown in the upper panel.
Current usage metrics show cumulative count of Article Views (full-text article views including HTML views, PDF and ePub downloads, according to the available data) and Abstracts Views on Vision4Press platform.
Data correspond to usage on the plateform after 2015. The current usage metrics is available 48-96 hours after online publication and is updated daily on week days.
Initial download of the metrics may take a while.