Free Access
Fig. 5
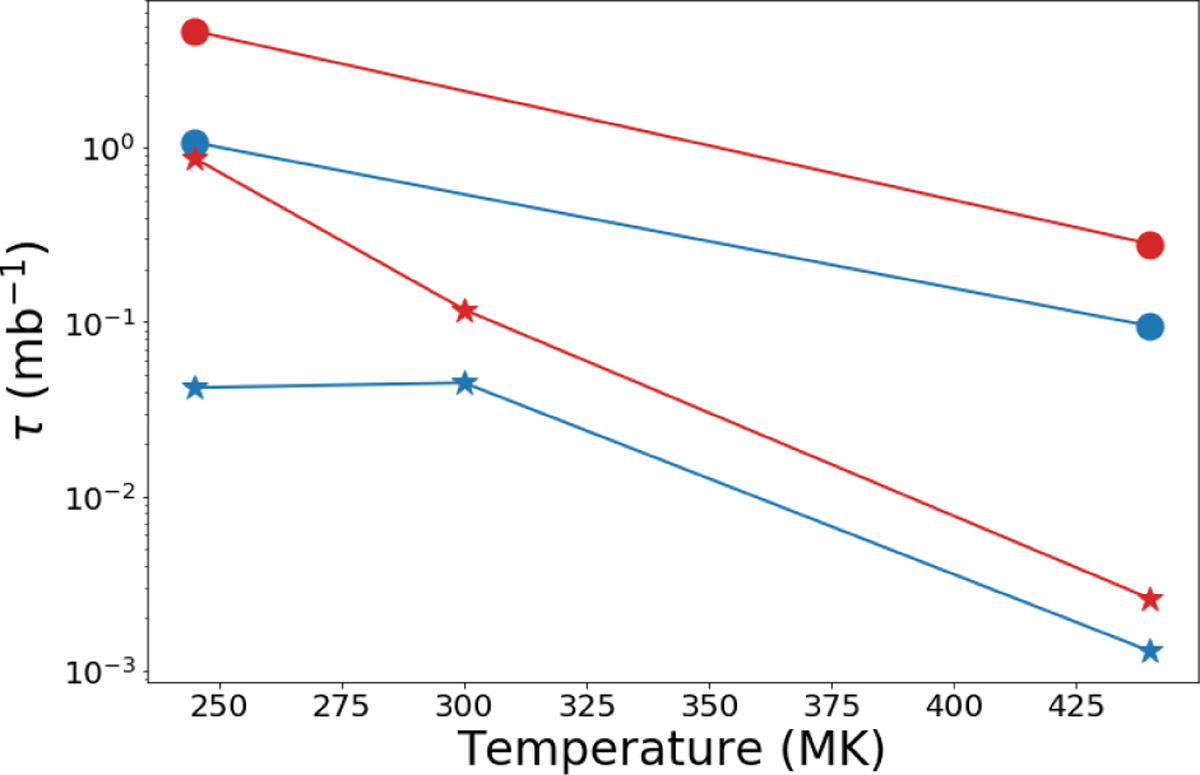
Download original image
Neutron exposure τ in mb−1 vs. RCB model temperature in MK. Red lines indicate a burning region defined as T > 200 MK, blue lines indicate a burning region defined by T > 100 MK. Closed circles denote solar metallicity models and stars indicate subsolar metallicity models. All models detailed in Crawford et al. (2020).
Current usage metrics show cumulative count of Article Views (full-text article views including HTML views, PDF and ePub downloads, according to the available data) and Abstracts Views on Vision4Press platform.
Data correspond to usage on the plateform after 2015. The current usage metrics is available 48-96 hours after online publication and is updated daily on week days.
Initial download of the metrics may take a while.