Fig. 4
Download original image
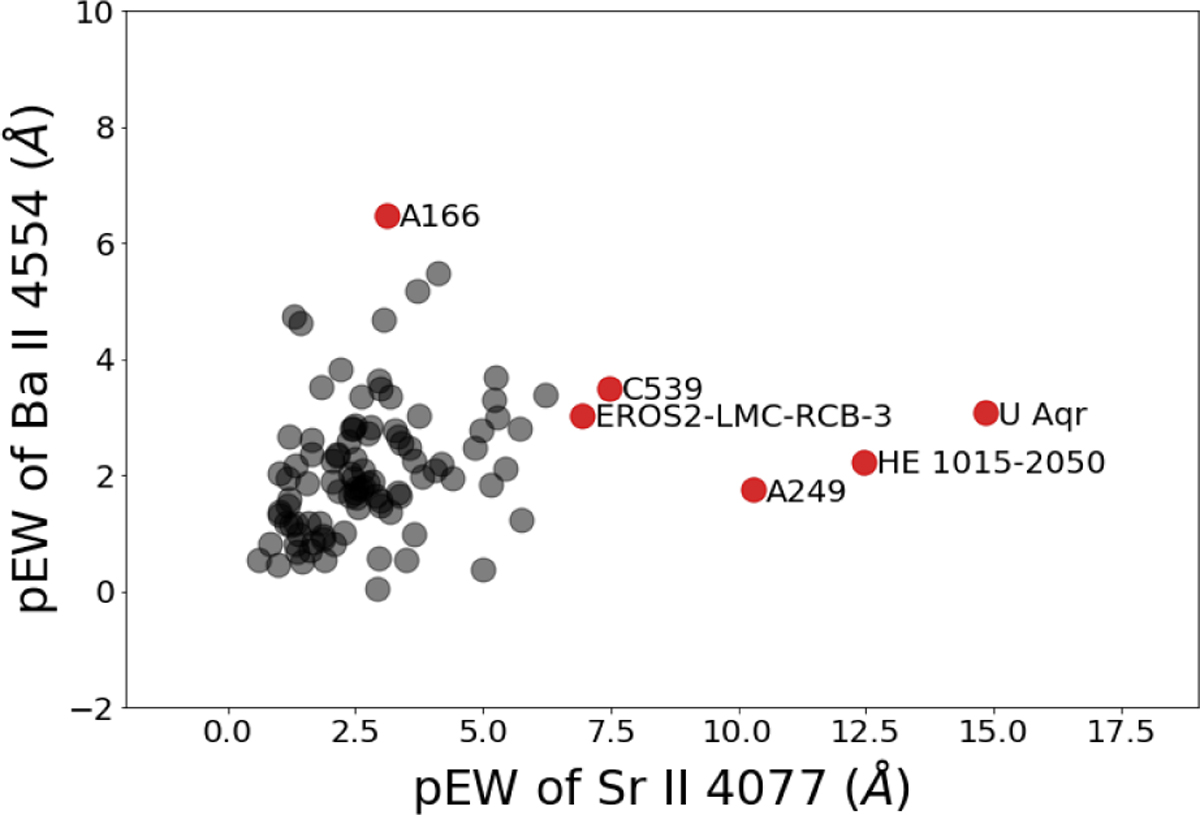
The pseudo-EW (pEW) of Sr II 4077 vs. Ba II 4554. The Sr-rich stars are plotted in red and labeled, and the rest of the stars in our HdC spectral sample are plotted in black. Note that we plot the pseudo-EWs of these lines rather than the traditional EWs as there is no true continuum to measure in many of these stars due to strong molecular bands.
Current usage metrics show cumulative count of Article Views (full-text article views including HTML views, PDF and ePub downloads, according to the available data) and Abstracts Views on Vision4Press platform.
Data correspond to usage on the plateform after 2015. The current usage metrics is available 48-96 hours after online publication and is updated daily on week days.
Initial download of the metrics may take a while.