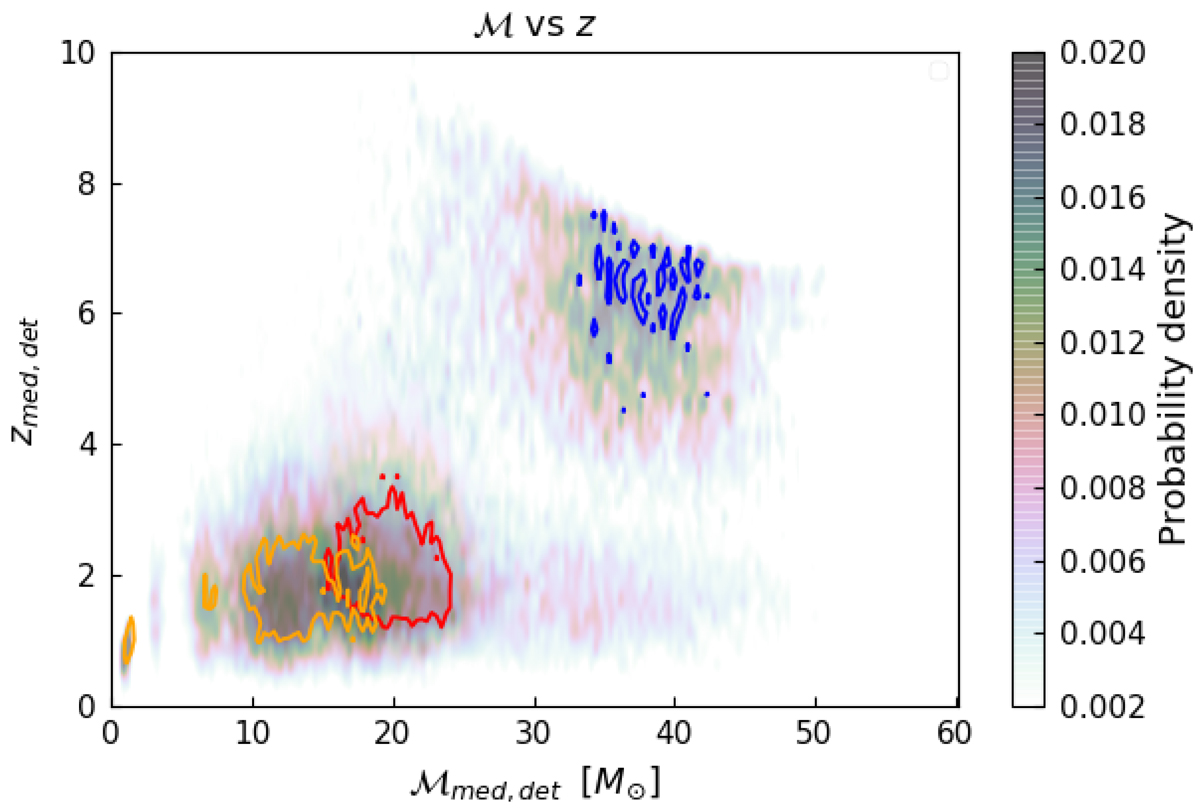
Fig. 8.
Download original image
Pop I+II, Pop III, and the GC population are plotted together with the contours showing the 90% probability region of the estimated medians of ℳ and z, for the three set of populations. The orange, blue, and red contours enclose the 90% probability region of the estimated median values of Pop I+II, Pop III, and the GC population, respectively. The density value shown in the colour bar corresponds to the density values for each of the three sets of the populations normalised individually.
Current usage metrics show cumulative count of Article Views (full-text article views including HTML views, PDF and ePub downloads, according to the available data) and Abstracts Views on Vision4Press platform.
Data correspond to usage on the plateform after 2015. The current usage metrics is available 48-96 hours after online publication and is updated daily on week days.
Initial download of the metrics may take a while.