Fig. 8.
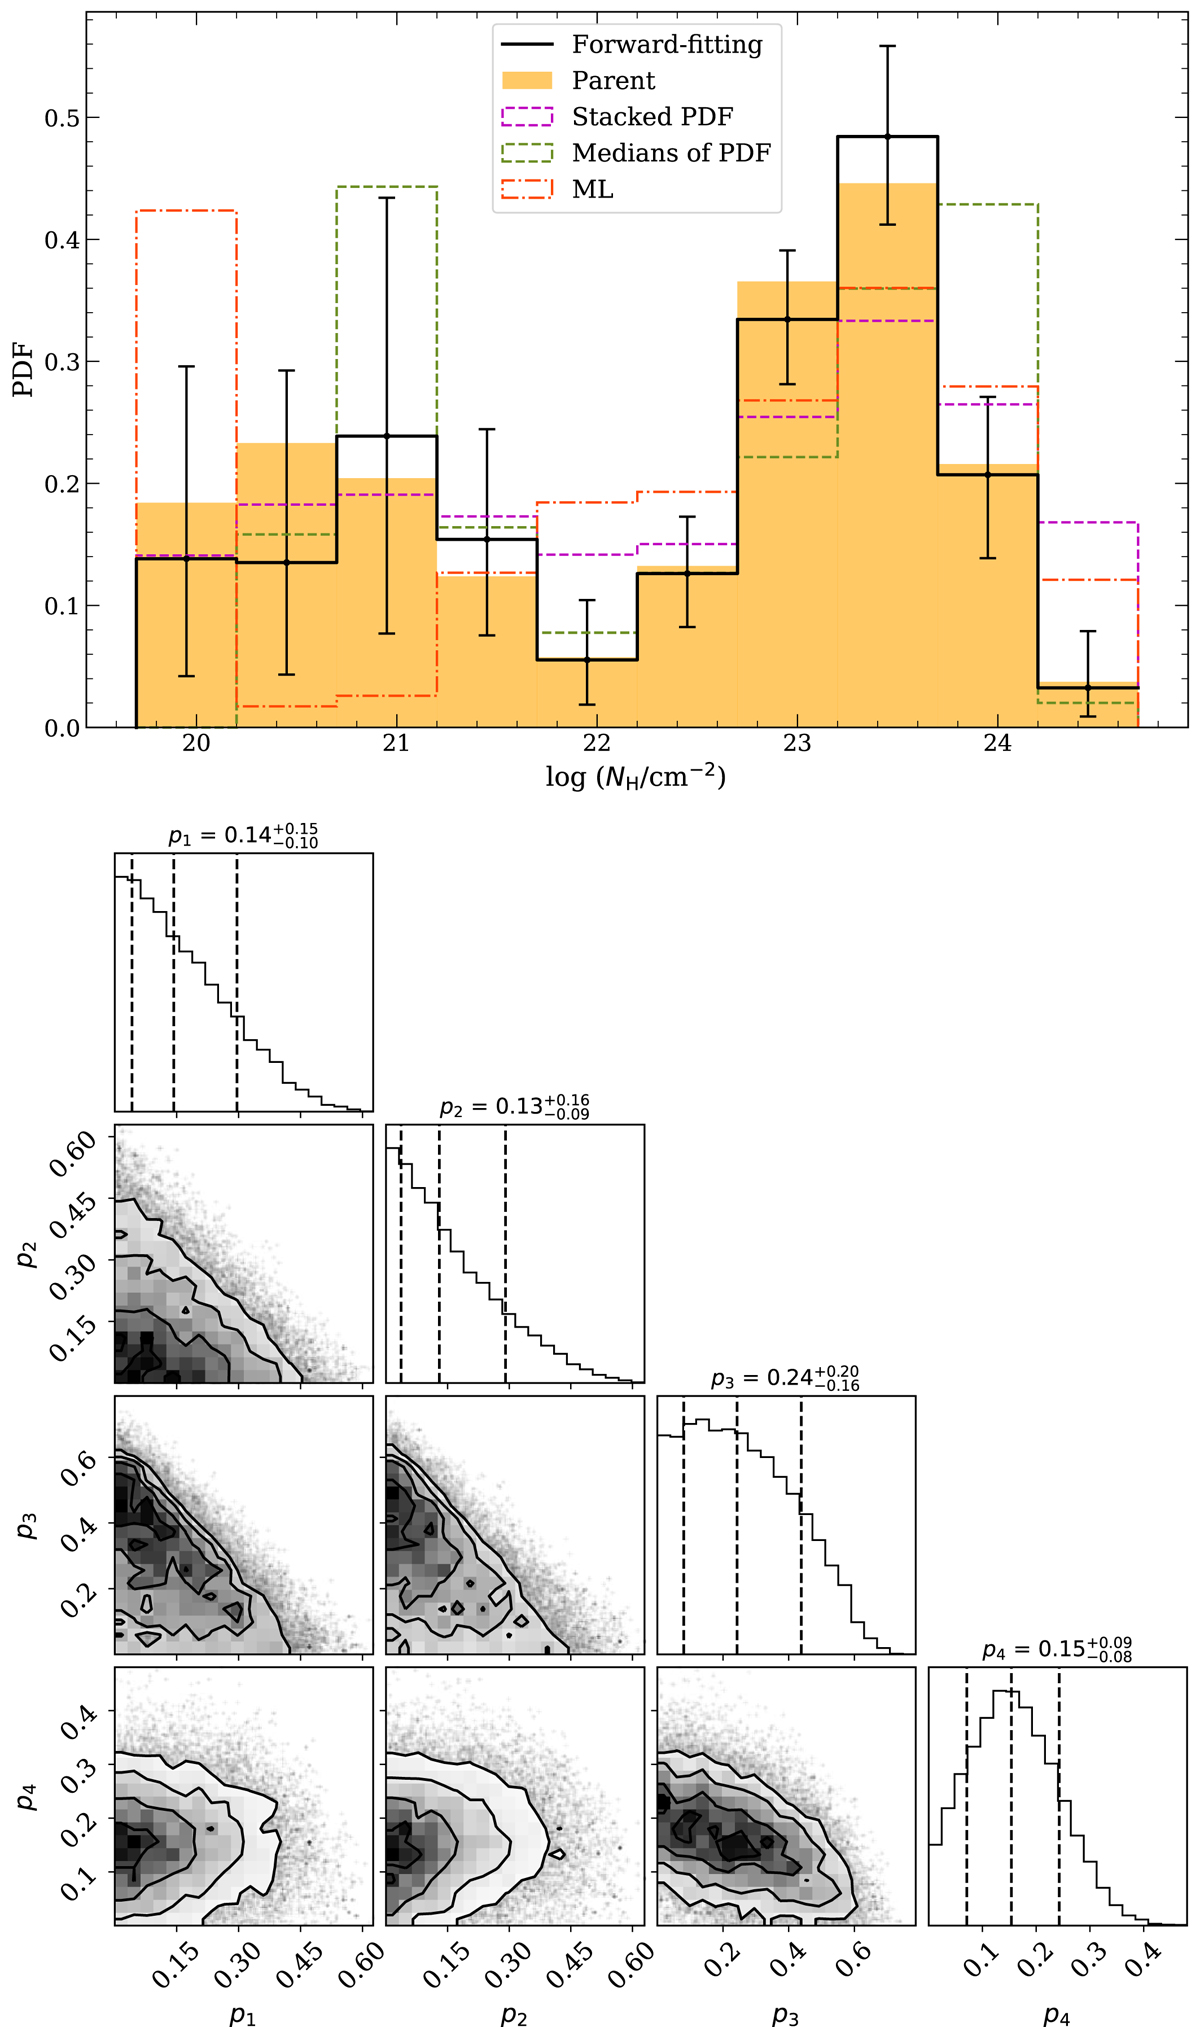
Download original image
Parent distributions of NH. Upper panel: parent distributions for a subsample that is the same size as the XMM-COSMOS data sample and is randomly selected from the simulation. The true distribution is plotted as the filled histogram in orange, and the reconstructed NH distribution obtained by applying FFPI is shown as the black line. The error bars show the 68.3% credible intervals. For comparison, the stacked PDFs, the distributions of medians, and the ML results are plotted in dashed magenta, dashed green, and dash-dotted red lines, respectively. All distributions are normalized to unit area. Lower panel: corner plot of the parameters of the first four bins (p1 − p4, converted to probability density for consistency with the lower panel) in the unabsorbed regime.
Current usage metrics show cumulative count of Article Views (full-text article views including HTML views, PDF and ePub downloads, according to the available data) and Abstracts Views on Vision4Press platform.
Data correspond to usage on the plateform after 2015. The current usage metrics is available 48-96 hours after online publication and is updated daily on week days.
Initial download of the metrics may take a while.