Open Access
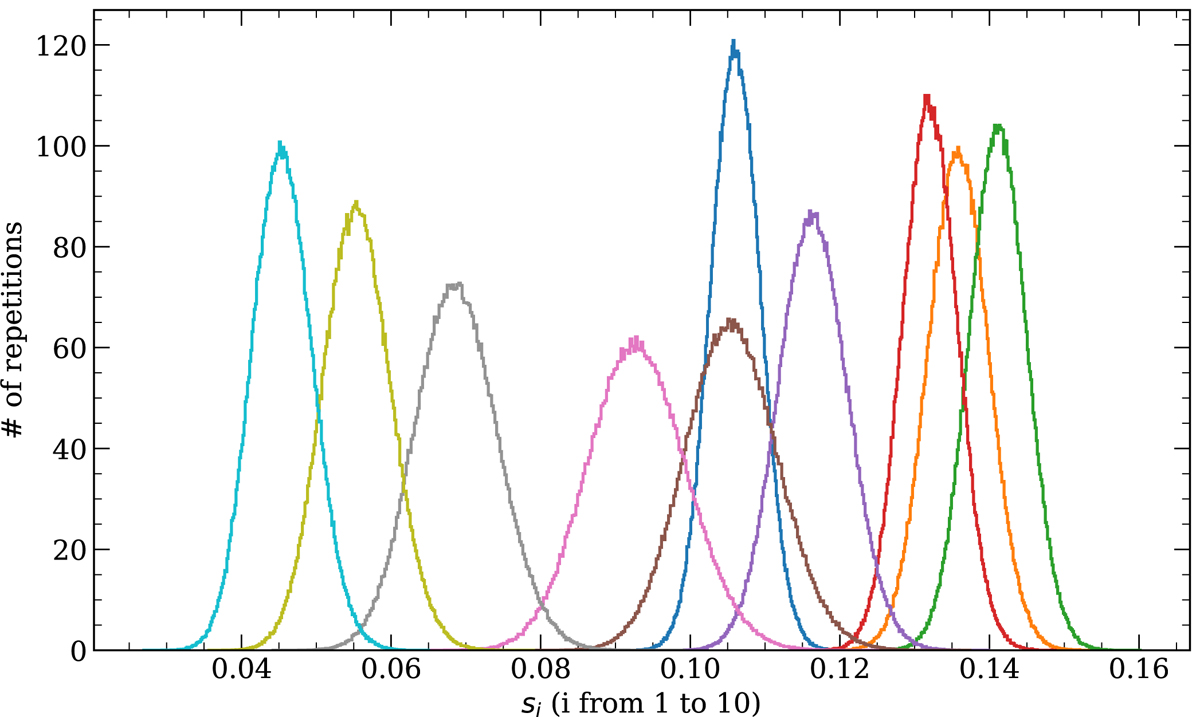
Fig. 7.
Download original image
Distributions of the parameters si of Astacked in the bootstrapped data sample. The x axis shows the value of si, and the y axis shows the number of repetitions. The curves with different colors correspond to the different bins. All distributions are normalized to unit area.
Current usage metrics show cumulative count of Article Views (full-text article views including HTML views, PDF and ePub downloads, according to the available data) and Abstracts Views on Vision4Press platform.
Data correspond to usage on the plateform after 2015. The current usage metrics is available 48-96 hours after online publication and is updated daily on week days.
Initial download of the metrics may take a while.