Fig. 5.
Download original image
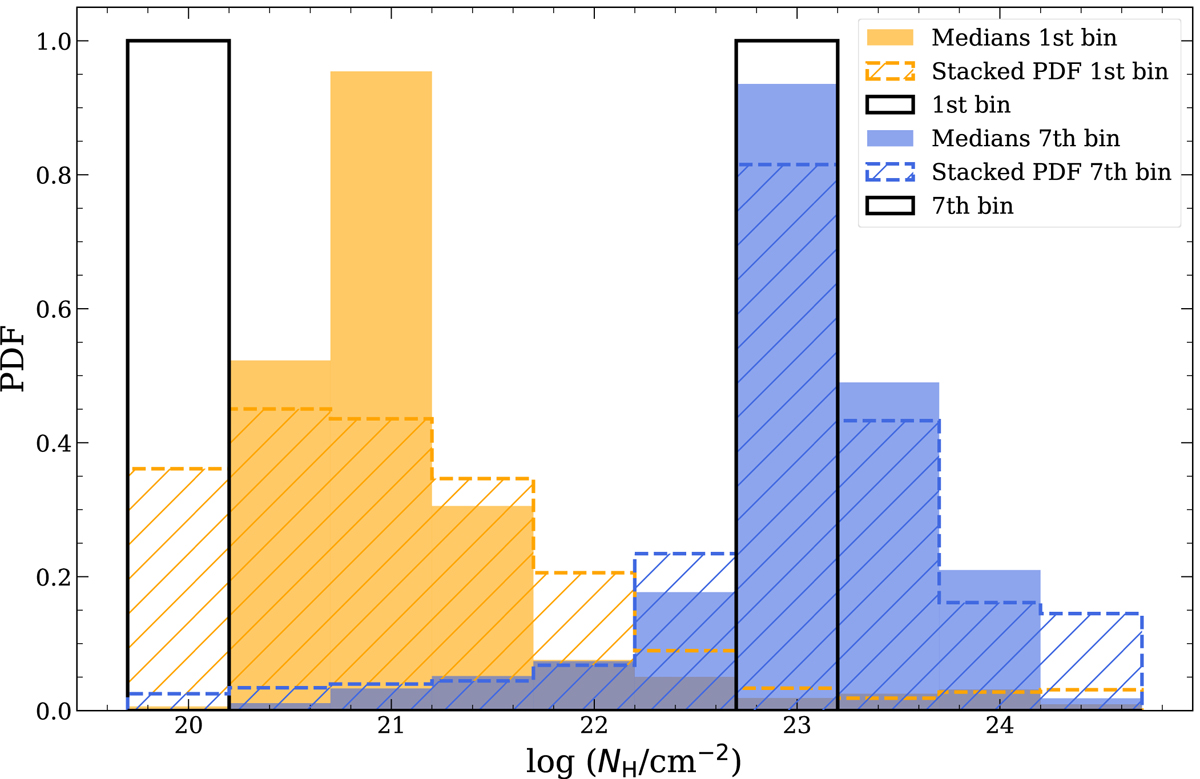
Stacked PDFs (hashed) and median distributions (filled) of the simulated sources with true NH below 1020.2 cm−2 (first bin) shown in orange, and those with NH from 1022.7 to 1023.2 cm−2 (seventh bin) shown in blue. The true NH distributions of the two bins are shown in black (amplitude fixed to 1 for clarity). All distributions are normalized to unit area.
Current usage metrics show cumulative count of Article Views (full-text article views including HTML views, PDF and ePub downloads, according to the available data) and Abstracts Views on Vision4Press platform.
Data correspond to usage on the plateform after 2015. The current usage metrics is available 48-96 hours after online publication and is updated daily on week days.
Initial download of the metrics may take a while.