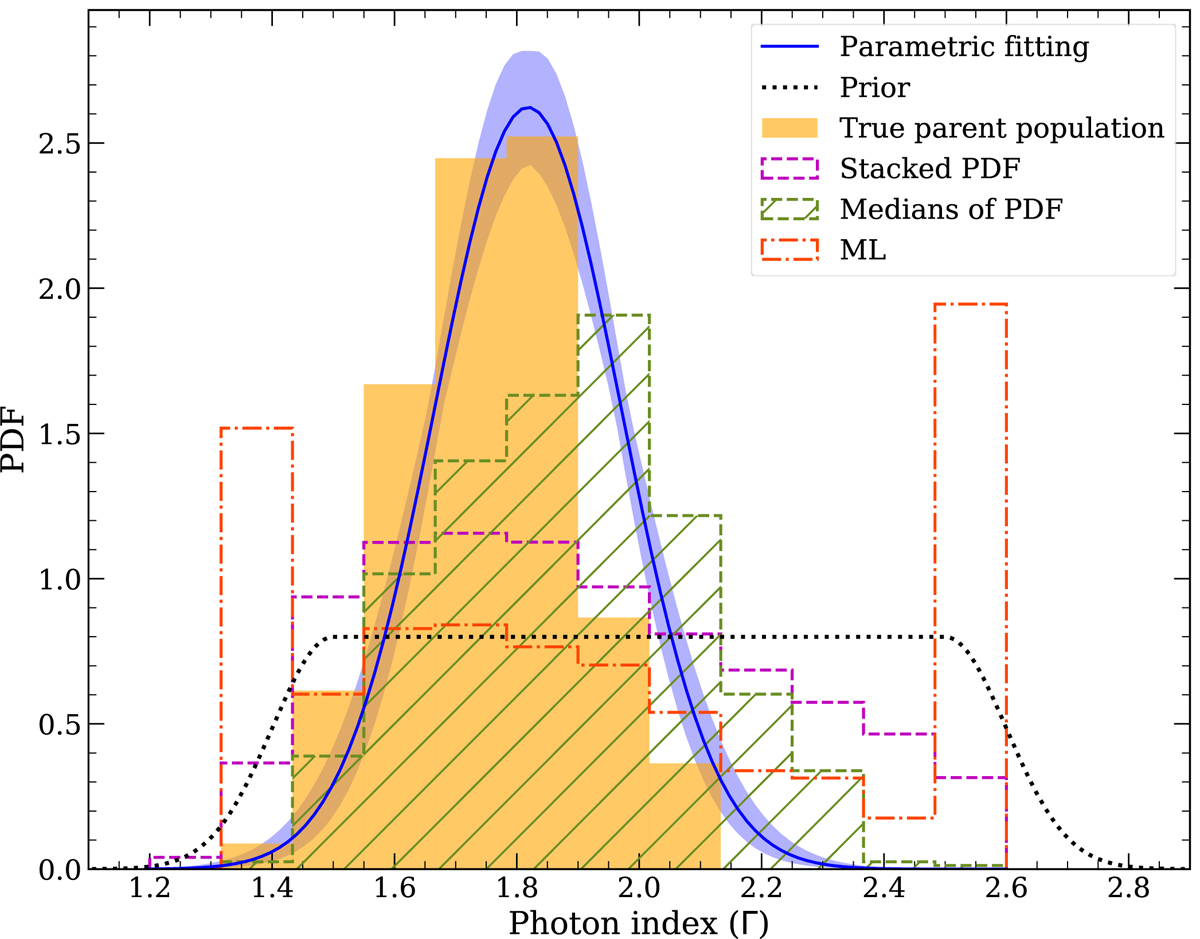
Fig. 4.
Download original image
Reconstructed parent distribution of Γ of a simulated sample using the parametric fitting approach in blue (see Sect. 4.1), with the filled area showing the 1σ credible interval. The true distribution is shown as the orange histogram, and the results using medians and stacked PDF are shown with dashed green (hatched) and magenta lines. The distribution of ML values is shown with a dash-dotted red line, and the dotted black line is the prior applied to Γ during the spectral fitting step. All distributions are normalized to unit area.
Current usage metrics show cumulative count of Article Views (full-text article views including HTML views, PDF and ePub downloads, according to the available data) and Abstracts Views on Vision4Press platform.
Data correspond to usage on the plateform after 2015. The current usage metrics is available 48-96 hours after online publication and is updated daily on week days.
Initial download of the metrics may take a while.