Fig. 3.
Download original image
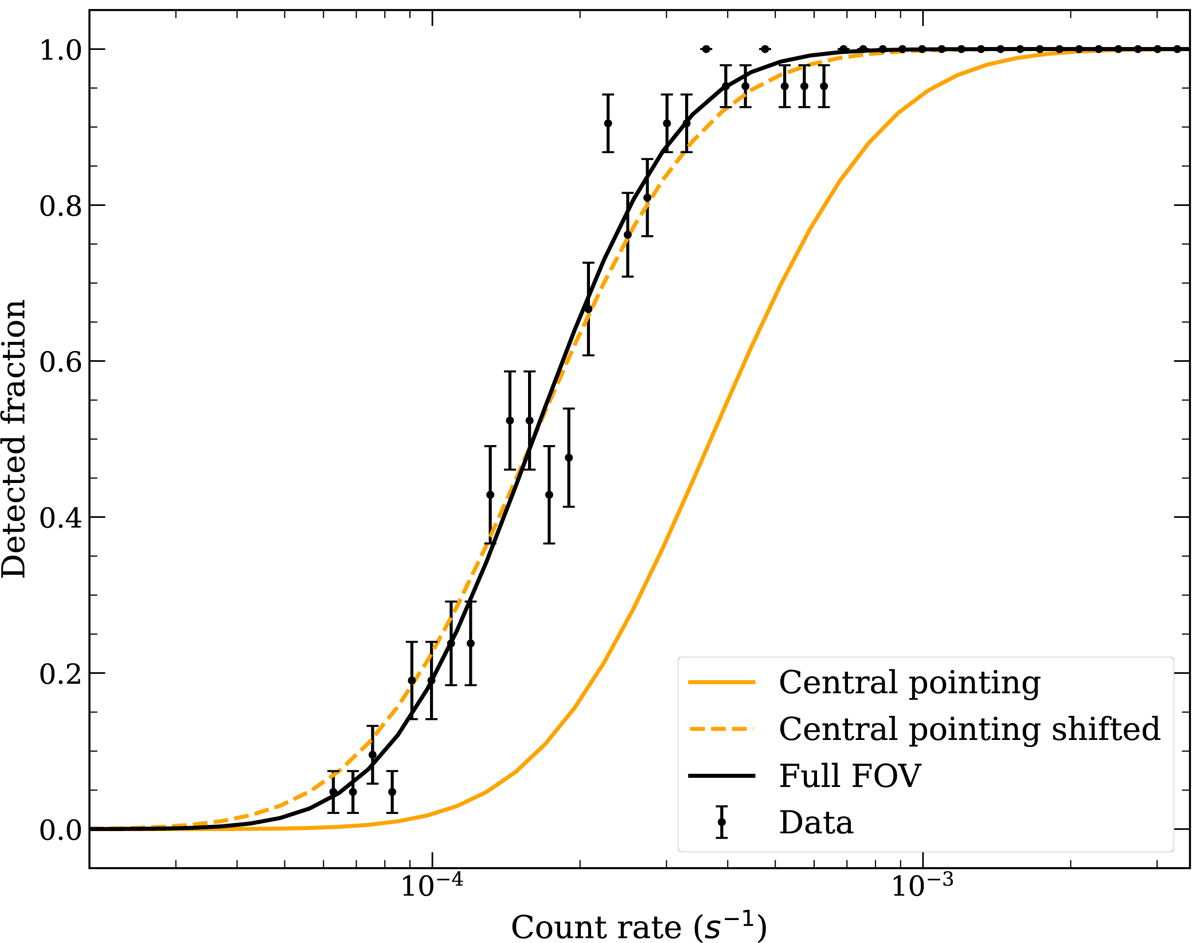
Selection function of the full mosaic (solid black line) fitted to the detected fraction of our simulated sources (black). The selection function in the central pointing is shown as a solid orange line. The dashed orange line shows the central-pointing selection function shifted to the same depth as that of the full field (same parameter b in Eq. (2) for comparison).
Current usage metrics show cumulative count of Article Views (full-text article views including HTML views, PDF and ePub downloads, according to the available data) and Abstracts Views on Vision4Press platform.
Data correspond to usage on the plateform after 2015. The current usage metrics is available 48-96 hours after online publication and is updated daily on week days.
Initial download of the metrics may take a while.