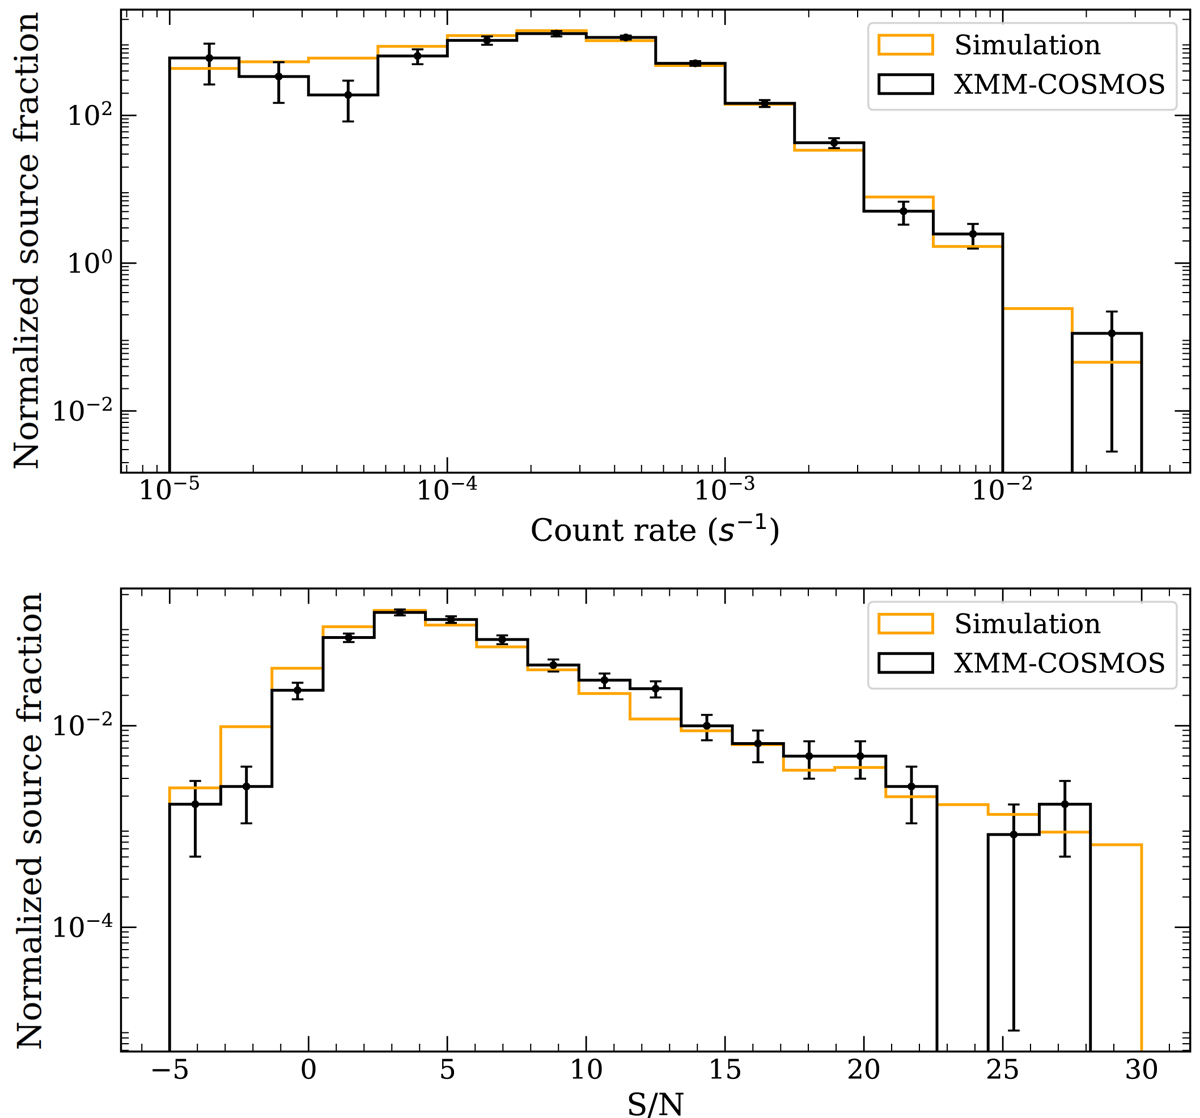
Fig. 2.
Download original image
Distributions of source count rates (top) and S/N (bottom) of the simulated sample (orange) and our XMM-COSMOS sample (black) determined in the 2–7 keV source detection band and normalized to unit area. 1σ errors on the histograms of the XMM-COSMOS sample are shown in black. The errors on the simulated sample are not presented since they are negligible in these plots.
Current usage metrics show cumulative count of Article Views (full-text article views including HTML views, PDF and ePub downloads, according to the available data) and Abstracts Views on Vision4Press platform.
Data correspond to usage on the plateform after 2015. The current usage metrics is available 48-96 hours after online publication and is updated daily on week days.
Initial download of the metrics may take a while.