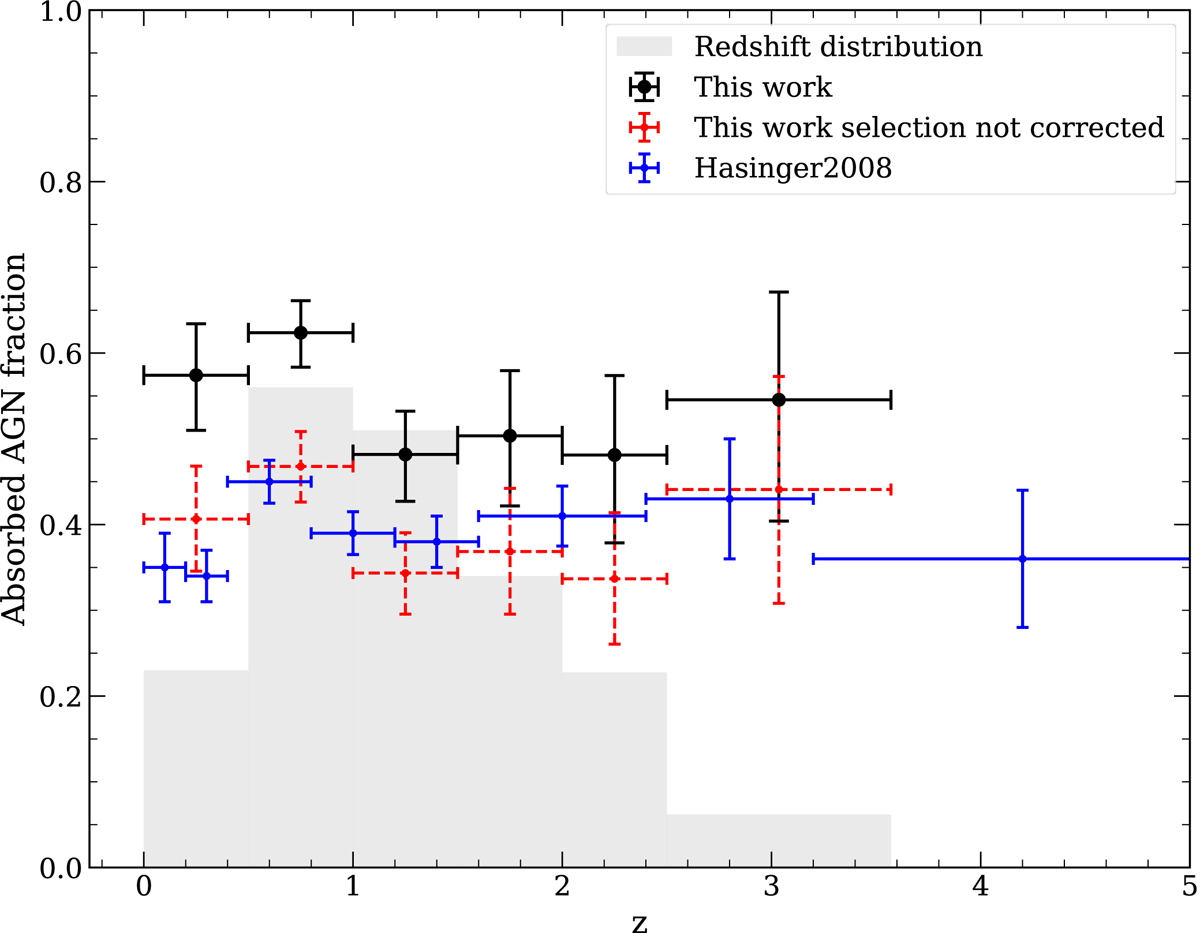
Fig. 14.
Download original image
Evolution of the absorbed fraction with redshift. Our results corrected for selection effects are shown in black. The results without selection correction are shown in red with dashed error bars. Vertical error bars show 68.3% credible intervals; horizontal error bars show the binning. The results of Hasinger et al. (2007) are shown in blue. The gray area shows the redshift distribution of our sample, including both spec-z and photo-z.
Current usage metrics show cumulative count of Article Views (full-text article views including HTML views, PDF and ePub downloads, according to the available data) and Abstracts Views on Vision4Press platform.
Data correspond to usage on the plateform after 2015. The current usage metrics is available 48-96 hours after online publication and is updated daily on week days.
Initial download of the metrics may take a while.