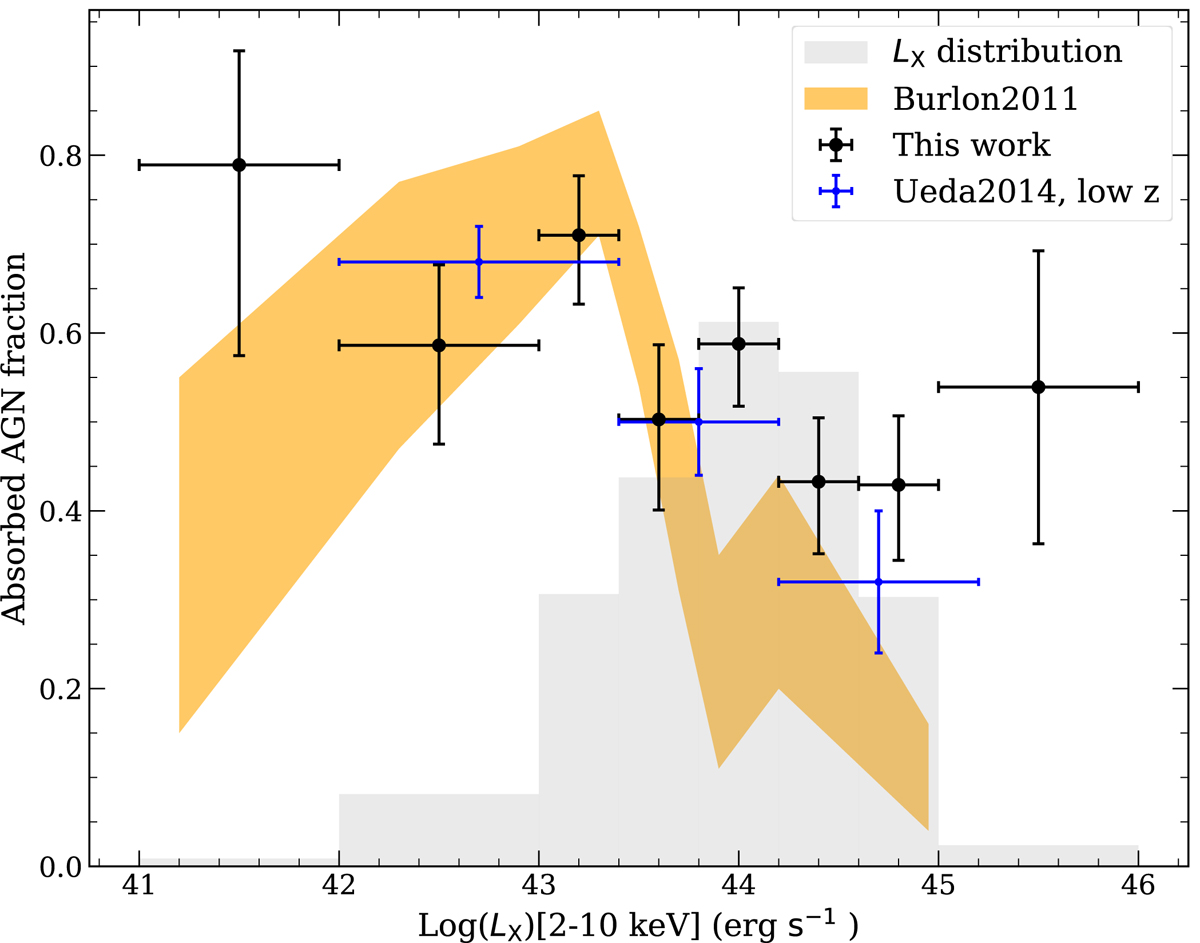
Fig. 13.
Download original image
Absorbed fraction versus 2–10 keV luminosity. Black points are the result of this work, taking selection effects into account; the vertical error bars show 68.3% credible intervals, and the horizontal error bars show the binning. The blue points are the results of Ueda et al. (2014) for low-redshift sources, and the orange area shows the results of Burlon et al. (2011). The gray area is the observed luminosity distribution in our sample.
Current usage metrics show cumulative count of Article Views (full-text article views including HTML views, PDF and ePub downloads, according to the available data) and Abstracts Views on Vision4Press platform.
Data correspond to usage on the plateform after 2015. The current usage metrics is available 48-96 hours after online publication and is updated daily on week days.
Initial download of the metrics may take a while.