Fig. 12.
Download original image
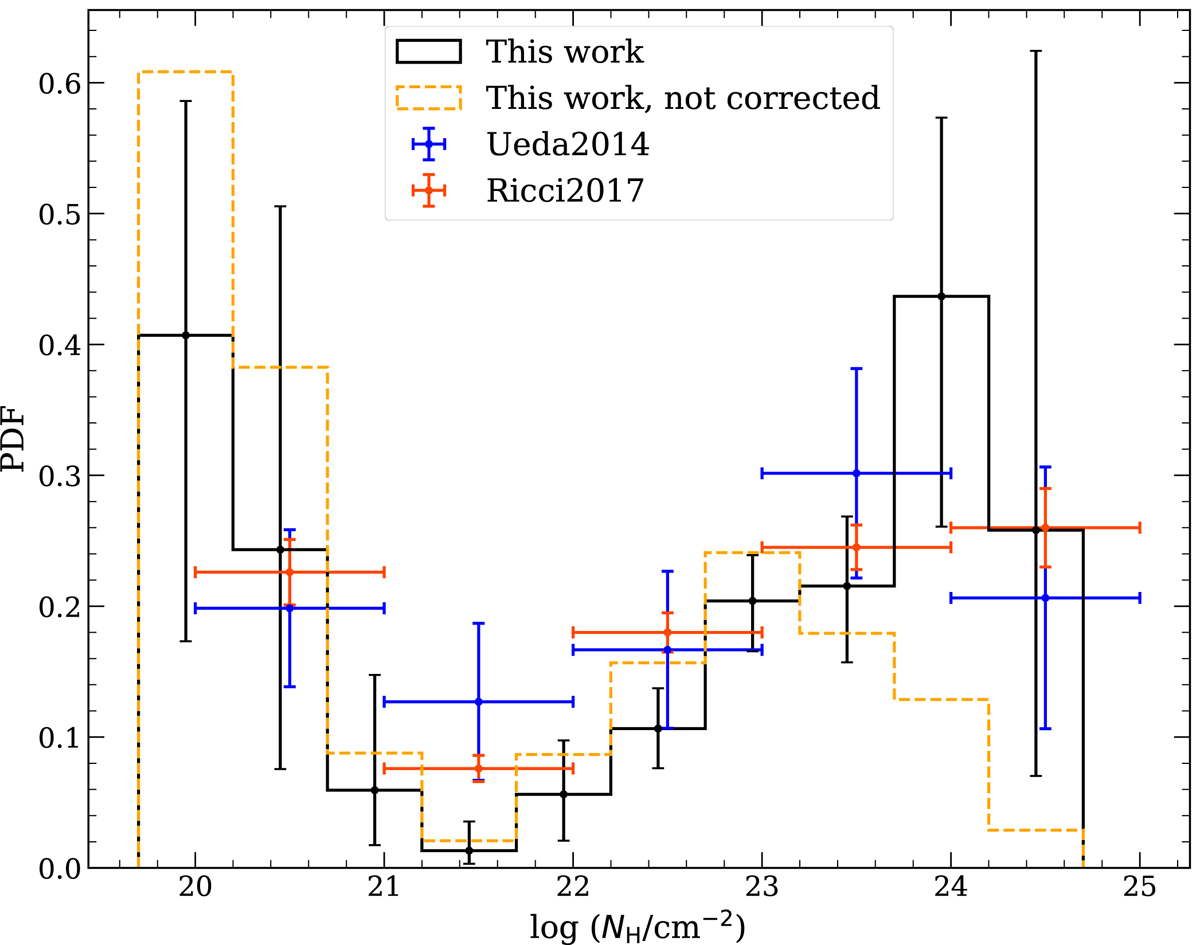
Observed distribution of NH inferred with our method (dashed orange line), and corrected for selection effects (solid black line), with vertical error bars representing 68.3% credible intervals. The blue and red points are the results from Ueda et al. (2014) and Ricci et al. (2017a), respectively. The horizontal error bars show the bins. All distributions are normalized to unit area.
Current usage metrics show cumulative count of Article Views (full-text article views including HTML views, PDF and ePub downloads, according to the available data) and Abstracts Views on Vision4Press platform.
Data correspond to usage on the plateform after 2015. The current usage metrics is available 48-96 hours after online publication and is updated daily on week days.
Initial download of the metrics may take a while.