Fig. 10.
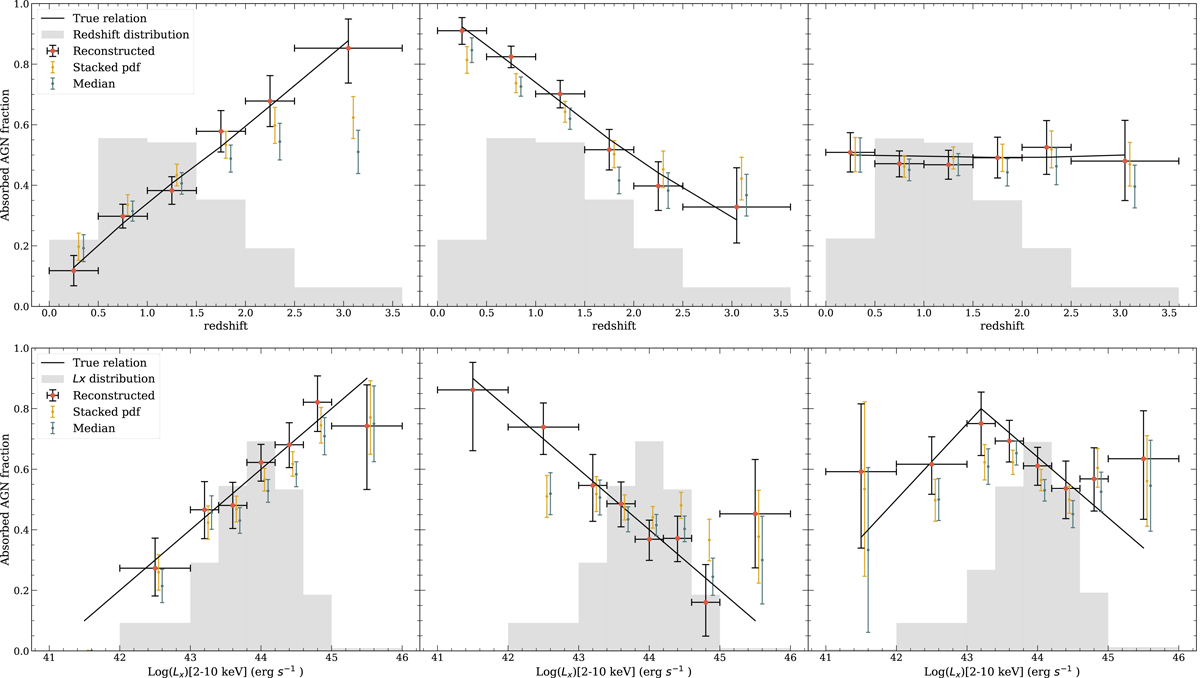
Download original image
Reconstruction of the absorbed AGN fraction versus redshift (top row) and LX (bottom row) for different subsamples of the simulation. The black line represents the true absorbed fraction relation in each redshift or LX bin, and the reconstructed one obtained by applying our method is plotted with red dots and vertical error bars showing the 68.3% credible intervals. The results of using stacked PDF and medians are shown in yellow and green, respectively. The gray histogram represents the LX or redshift distributions of the simulated sample.
Current usage metrics show cumulative count of Article Views (full-text article views including HTML views, PDF and ePub downloads, according to the available data) and Abstracts Views on Vision4Press platform.
Data correspond to usage on the plateform after 2015. The current usage metrics is available 48-96 hours after online publication and is updated daily on week days.
Initial download of the metrics may take a while.