Fig. 1.
Download original image
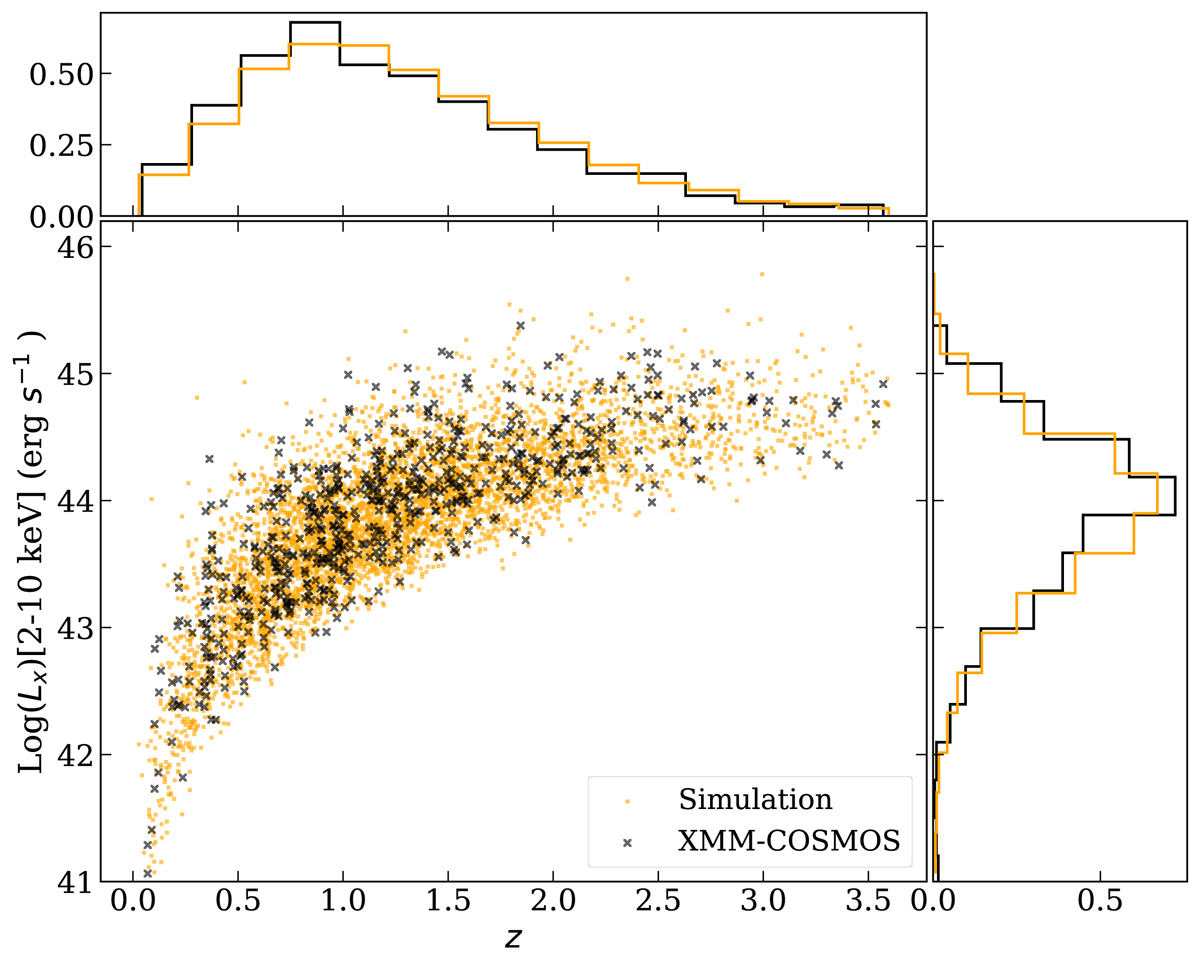
Scatter plot of redshift versus intrinsic LX in the 2–10 keV band. The histograms of these two parameters, normalized to have unit area, are plotted in the top and right subpanels. The simulated sample is plotted in orange, and the XMM-COSMOS data sample is plotted in black. LX is calculated using the median of the PDFs from the spectral analysis.
Current usage metrics show cumulative count of Article Views (full-text article views including HTML views, PDF and ePub downloads, according to the available data) and Abstracts Views on Vision4Press platform.
Data correspond to usage on the plateform after 2015. The current usage metrics is available 48-96 hours after online publication and is updated daily on week days.
Initial download of the metrics may take a while.