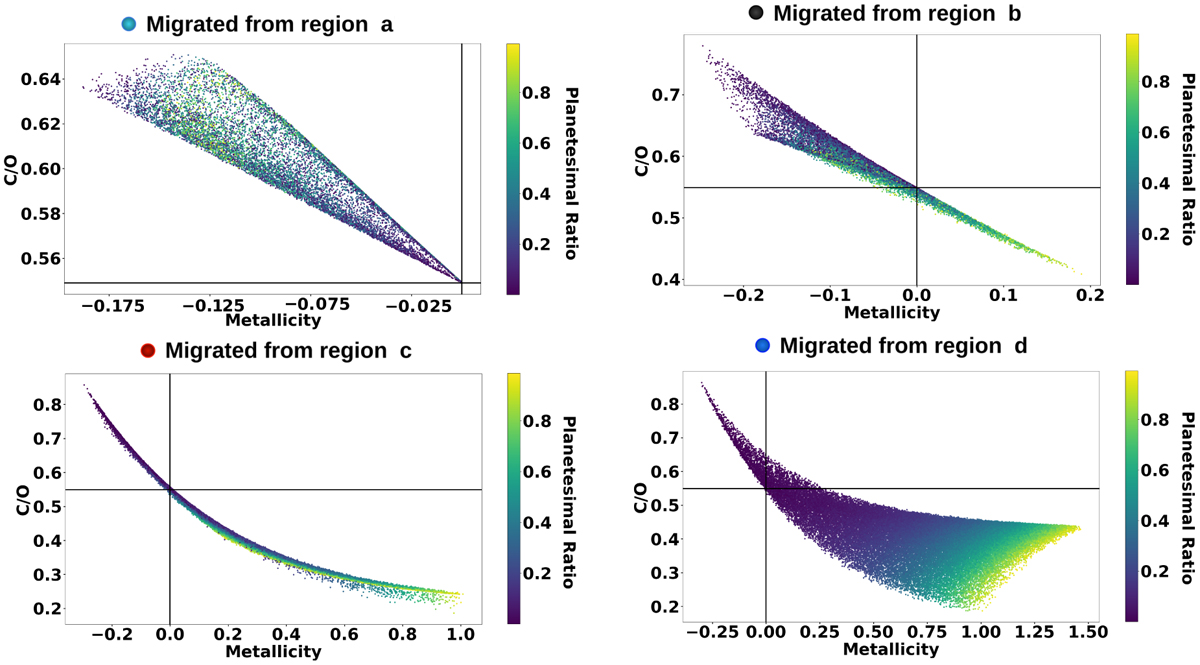
Fig. 9
Download original image
C/O ratio and the log scale metallicity of the planets formed by SimAb presented in Fig. 5. The color bar indicates the planetesimal ratio. Shown are zoom-ins on the four regions explained in Fig. 5. Planets that initiate their formation in region A in disks with higher planetesimal ratio, show lower metallicity and a higher C/O ratio. On the other hand, planets that initiate their formation in regions B, C, or D show a very strong correlation with the planetesimal ratio. Planets that initiate their formation in these regions with a high planetesimal ratio show a higher metallicity and a lower C/O ratio. In all four plots the planets that are formed in disks with higher dust grain fractions show metallicities and C/O ratios closer to the solar value. This relation becomes less strong for planets that initiate their formation in farther regions, such as regions C and D.
Current usage metrics show cumulative count of Article Views (full-text article views including HTML views, PDF and ePub downloads, according to the available data) and Abstracts Views on Vision4Press platform.
Data correspond to usage on the plateform after 2015. The current usage metrics is available 48-96 hours after online publication and is updated daily on week days.
Initial download of the metrics may take a while.